

![Grafana 101: Interactivity, Templating, and Sharing [Recap]](/blog/content/images/size/w300/2020/06/Screen-Shot-2020-06-10-at-11.06.05-AM.png)
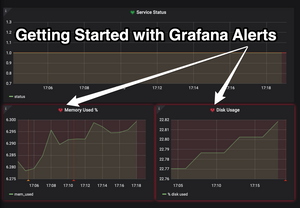
![Grafana 101: Getting Started with Alerting [Recap]](/blog/content/images/size/w300/2020/06/GrafanaAlertsBlogCover.png)

![[New Webinar]: How to analyze your Prometheus data in SQL: 3 queries you need to know](/blog/content/images/size/w300/2020/03/Screen-Shot-2020-03-16-at-11.25.30-AM-1.png)


Timeseries and analytics
PostgreSQL, but faster. Built for lightning-fast ingest and querying of time-based data.
Timeseries and analyticsAI and Vector
PostgreSQL engineered for fast search with high recall on millions of vector embeddings.
Vector (AI/ML)Dynamic PostgreSQL (Early Access)
PostgreSQL managed services with the benefits of serverless but none of the problems.
Dynamic PostgreSQLDeployment options & services
Timescale Cloud
A reliable and worry-free PostgreSQL cloud for your business workloads.
Timescale CloudSupport Services
Support options to adapt to your use case, infrastructure, and budget.Open-Source Extensions and Tools
Open-source PostgreSQL extensions you can run on your own instances.Time series and analytics
AI and Vector
Security scanner
Timescale is PostgreSQL made Powerful.
Industries that rely on us
Featured articles

How OpenSauced Is Building a Copilot for Git History With pgvector and Timescale
Read now
Timescale Docs
PostgreSQL, but faster. Built for lightning-fast ingest and querying of time-based data.
Timescale DocsAI and Vector
PostgreSQL engineered for fast search with high recall on millions of vector embeddings.
AI/VectorLearn PostgreSQL
Timescale is PostgreSQL, but faster. Learn the PostgreSQL basics and scale your database performance to new heights
Timescale benchmarks
Subscribe to the Timescale Newsletter
By submitting, you acknowledge Timescale's Privacy Policy
Subscribe to the Timescale Newsletter
By submitting, you acknowledge Timescale's Privacy Policy