Guide to Grafana 101: Getting Started With (Awesome) Visualizations
If you’re working with data, odds are you need a way to visualize your data—either for yourself or to share with your team, wider organization, or your end-users. There’s no shortage of tools available, and I’ve used several: Tableau, Looker, PowerBI, and my latest favorite, Grafana.
So that we’re all on the same page, Grafana is an open-source visualization tool that’s growing in popularity with developers (including me!) for its wide variety of data sources, open-source licensing, and support for many useful visualization types.
But using Grafana isn’t without a learning curve. In my conversations with developers and in my own experiences, it can take weeks—if not months—to master the art of creating useful visualizations. There are many features you may not know how, when, or why to use, like filters, charts, gauges, and even world maps.
What if you could shorten that time and get up and running with the visualizations you need immediately (or add to ones you’ve already built)?
In my webinar, Guide to Grafana 101: Getting Started with (Awesome) Visualizations, I show you how to use SQL and TimescaleDB to build Grafana charts, gauges, and beyond for any time-series dataset.
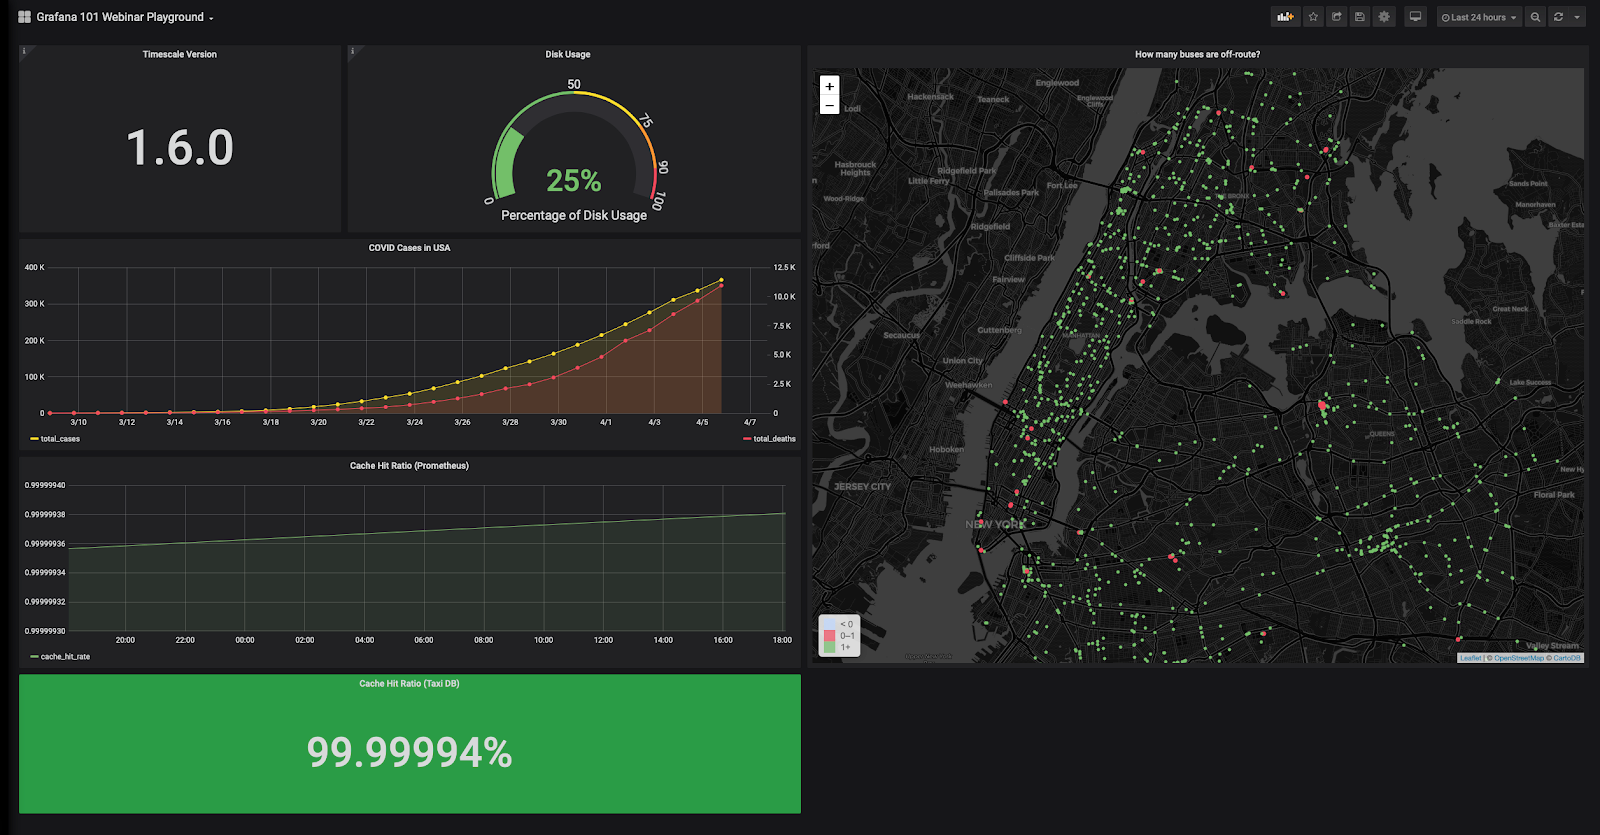
I focus on code and step-by-step live demos. I use my and my teammates’ time-series datasets to create various panels (what Grafana calls its charts and visualization types) and an example monitoring dashboard.
By the end, you will have seen me:
- Set up a datasource for Grafana.
- Create 5+ different visualizations for data from IoT, infrastructure monitoring, and public datasets.
- Combine geospatial and time-series data in our dashboards.
Whether you’ve never used Grafana and are looking for a cheaper alternative to proprietary visualization tools or are a Grafana pro who’s looking for some other tips and tricks, this session is bound to teach you a thing (or two or five).
My goal is that you leave the session with the practical skills and inspiration you need to build your own (awesome) Grafana dashboards for your projects.
Enjoy!