How to Create a Grafana Dashboard to Visualize Data

A popular data visualization tool, Grafana allows you to create customizable dashboards and effectively monitor your systems and applications.
Grafana is organized into Dashboards and Panels. A dashboard represents a
view into the performance of a system, and each dashboard consists of one or
more panels, which represent information about a specific metric related to
that system.
In this tutorial, you'll build a simple dashboard, connect it to TimescaleDB,
and visualize data.
Prerequisites
Before you begin, make sure you have:
When your installation of TimescaleDB and Grafana is complete, ingest the data
found in the NYC Taxi Cab tutorial and configure Grafana to connect
to that database.
Build a new dashboard
Start by creating a new dashboard. In the far right toolbar of the Grafana user
interface, you'll see a + icon. Select it and select New dashboard.
After creating a new dashboard, you'll see a New dashboard screen. To proceed with the tutorial, add a new visualization by clicking the + Add visualization option.
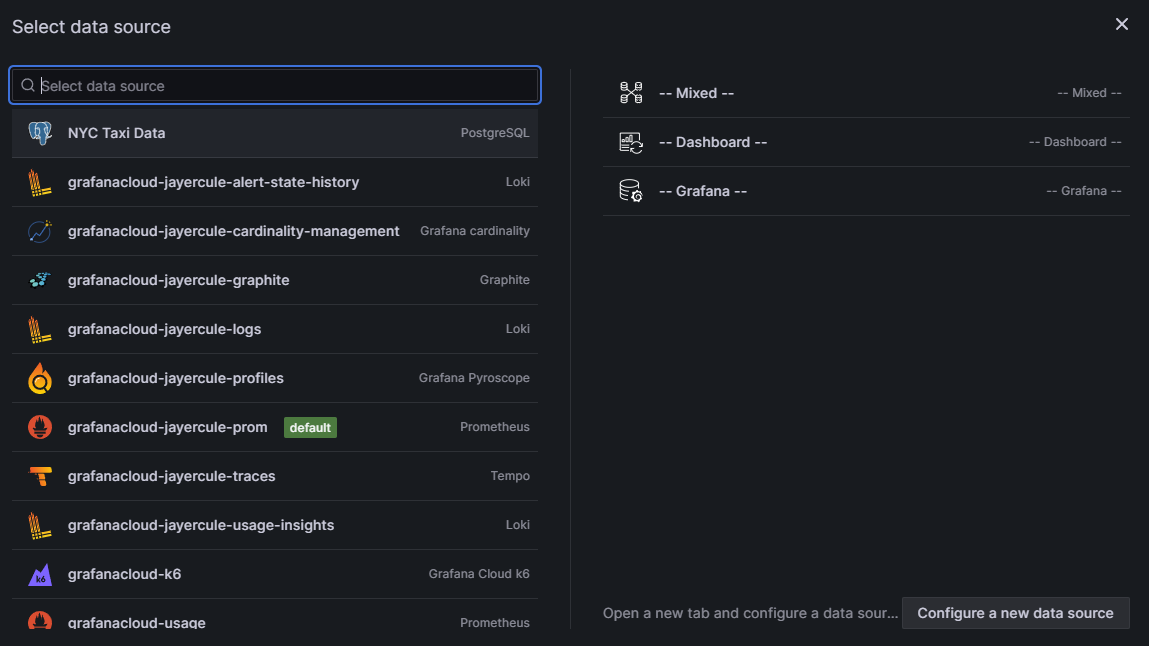
In Select data source, select the connection to your NYC Taxi Data that you created earlier.
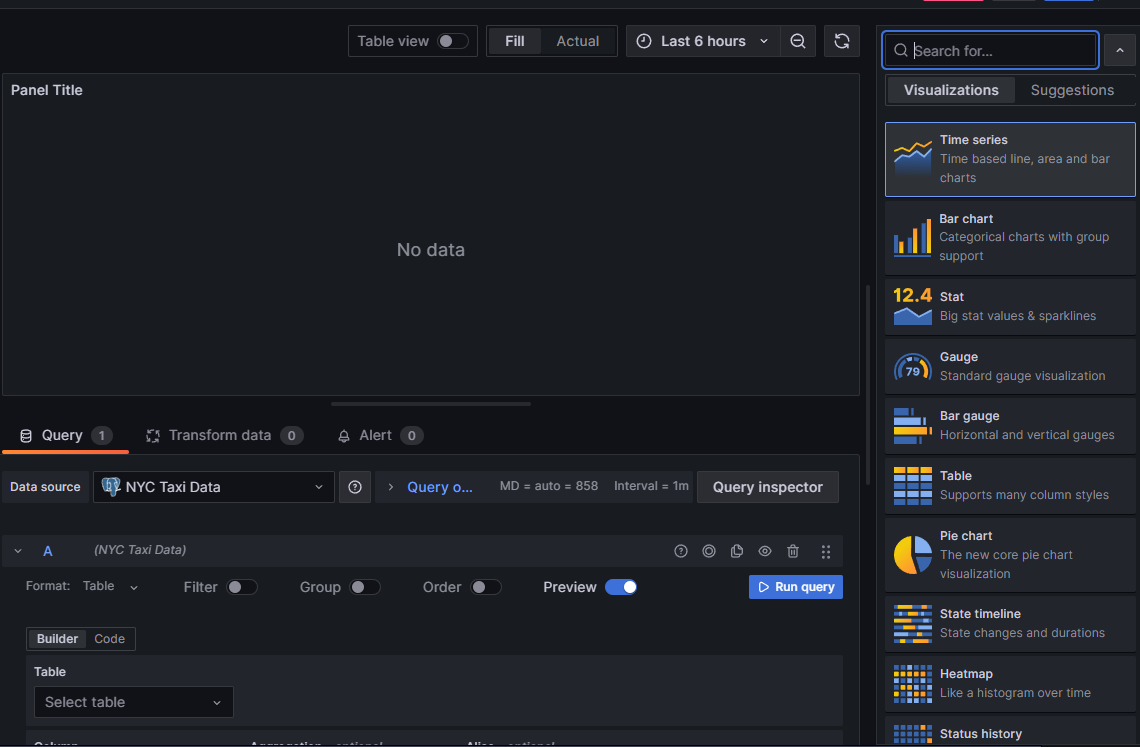
At this point, you'll have several options for different Grafana visualizations on the right-hand side of the panel. Select Visualizations and then select Time series.
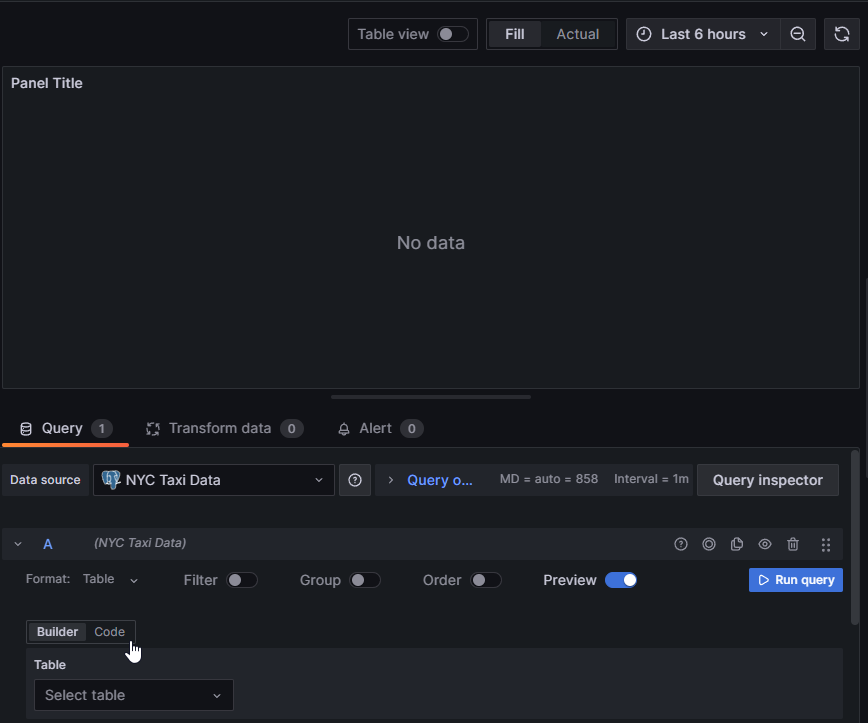
Next, you will need to create a query for your data. The query builder is below the visualization panel. You have two options for building a query: Builder (the form-based query editor) and Code. Select Code.
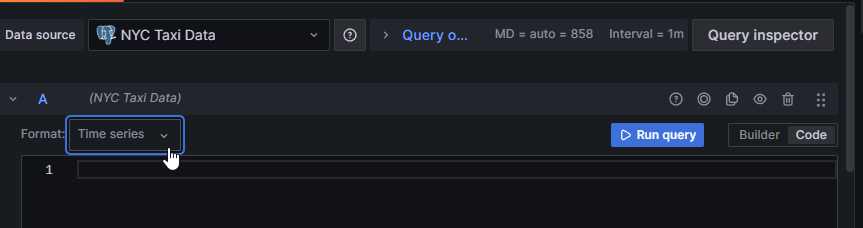
After switching to Code, from the Format drop-down, select Time series.
Visualize metrics stored in TimescaleDB
Start by creating a visualization that answers the question, "How many
rides took place on each day?" from the NYC Taxi Cab tutorial.
From the tutorial, you can see the standard SQL syntax for our query:
SELECT date_trunc('day', pickup_datetime) AS day,
  COUNT(*)
FROM rides
GROUP BY day
ORDER BY day;
You need to alter this query to support Grafana's unique query syntax.
Modifying the SELECT statement
First, you'll modify the date_trunc function to use the TimescaleDB time_bucket function. You can consult the TimescaleDB API Reference on time_bucket for more information on how to use it properly.
Take a look at the SELECT portion of this query. First, bucket the results into one-day groupings using the time_bucket function. If you set the Format of a Grafana panel to be Time series, for use in the graph panel, for example, then the query must return a column named time that returns either an SQL datetime or any numeric datatype representing a Unix epoch.
Modify your query so that the output of the time_bucket grouping is labeled time as Grafana requires. You also need to group your visualizations by the time buckets you've selected and order the results by the time buckets as well. So, the GROUP BY and ORDER BY statements reference the time variable:
SELECT
  time_bucket('1 day', pickup_datetime) AS "time",
  COUNT(*)
FROM rides
GROUP BY time
ORDER BY time;
The Grafana timeFilter function
Grafana time-series panels include a tool that lets you filter on a given time range, called a time filter. Not surprisingly, Grafana has a way to link the user interface construct in a Grafana panel with the query itself. In this case, it's the $__timefilter() function.
In this example of a modified query, use the $__timefilter() function to set the pickup_datetime column as the filtering range for your visualizations: time.
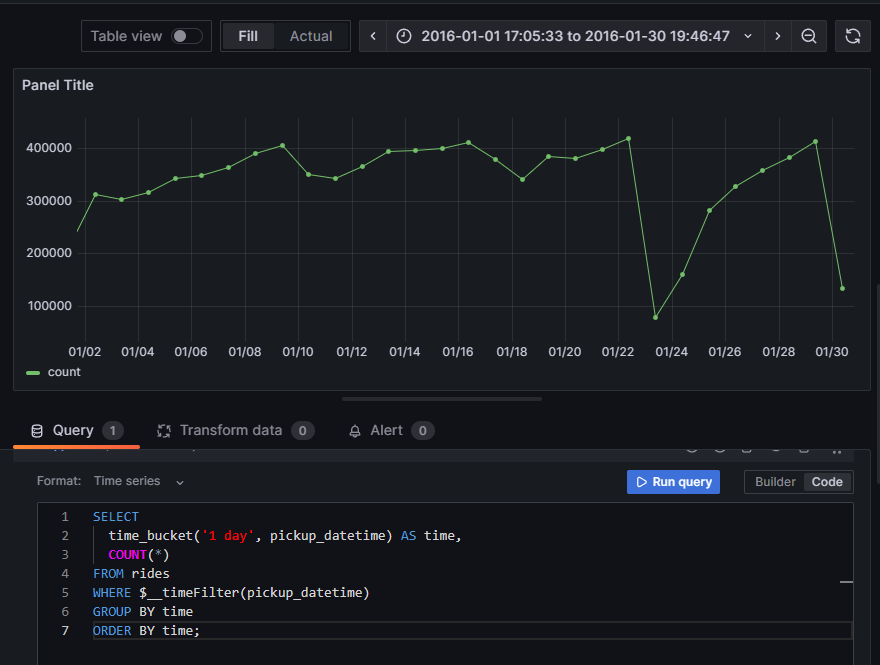
With these changes, this is the final Grafana query:
SELECT
  time_bucket('1 day', pickup_datetime) AS time,
  COUNT(*)
FROM rides
WHERE $__timeFilter(pickup_datetime)
GROUP BY time
ORDER BY time;
When you visualize this query in Grafana, you see this:
Currently, the data is bucketed into one-day groupings. Adjust the time_bucket
function to be bucketed into five-minute groupings instead and compare the graphs:
SELECT
  time_bucket('5m', pickup_datetime) AS time,
  COUNT(*)
FROM rides
WHERE $__timeFilter(pickup_datetime)
GROUP BY time
ORDER BY time
When you visualize this query, it looks like this:

Next Steps
Complete your Grafana knowledge by following more Timescale and Grafana tutorials:
- Use Grafana to visualize geospatial data stored in Timescale
- Analyzing 5 Million NFT Sales on OpenSea using PostgreSQL