Grafana 101: Getting Started With Alerts
In the first session of our Grafana 101 series, we showed you how to create awesome visualizations to gain insight into real-time performance of your systems, including gauges to track thresholds, single stats to show cache-hit ratios and more.
But what happens when things go wrong? When something crashes, you’re consuming too much memory, there’s an outage, or users report performance degradation, you need to know about it and take action ASAP.
In Guide to Grafana 101 Part II: Getting Started With Alerts, I take you from zero to hero in using Grafana to get notified about anomalies, dig into root causes, notify the right teams, and respond to critical issues.
Grafana isn’t only for creating (awesome) visualizations
While there are many monitoring systems, Grafana is a great choice. It supports data sources like PostgreSQL, Prometheus, AWS CloudWatch, and many other popular services and integrates with the communication tools your team already uses (including Slack, OpsGenie, email, and PagerDuty). It’s also open source, making it a popular choice for developers looking for something that’s flexible and cost-effective.
Getting set up with alerting can be tricky business. You want to balance alerting on the right metrics and quickly notifying your team while keeping false positives down and ensuring you don’t give others notification fatigue.
What you'll learn
As always, I focus on code and step-by-step live demos.
We use a scenario where we want to monitor our production database (something we often hear from Timescale customers). I will take you through creating and setting alerts based on different rules, like averages over a period of time, ranges, and thresholds—and how to close the loop and send alerts to our team in real time.
More specifically, you’ll:
- Get an understanding of how alerts work in Grafana
- See how to define key metrics for your scenario and apply them to Grafana’s alerting capabilities*
- Walk through example queries for graphing key metrics and triggering your alerts
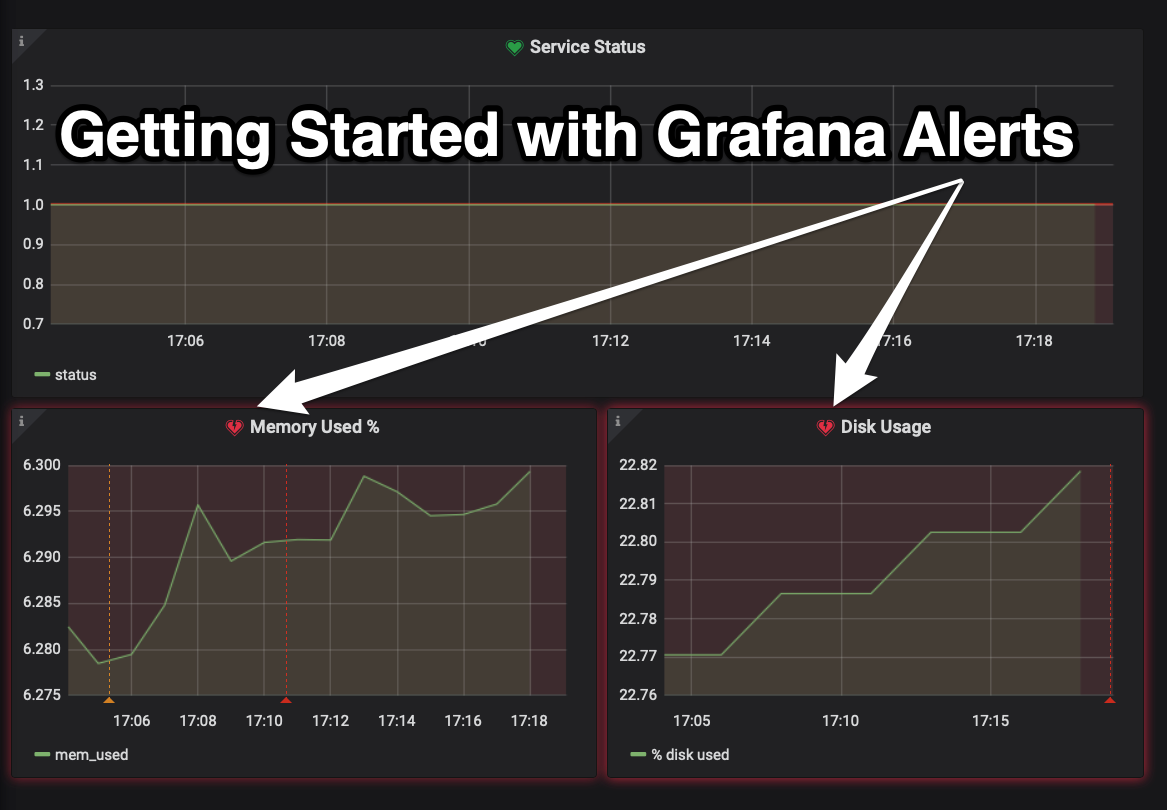
- Define different alerting rules for specific metrics, including uptime/downtime, average CPU, memory consumption, and total disk usage
- Set up and receive alerts via various notification channels, like Slack and OpsGenie
* (we’ll use metrics critical to monitoring a database, but you may be monitoring a website, Kubernetes cluster, or a larger infrastructure system).

Whether you’ve never used Grafana and are looking for a cheaper alternative to proprietary monitoring tools or are a Grafana pro who’s looking to level up your alerting skills, this session is for you.
My goal is that you leave the session with an understanding of when, why, and how to use Grafana alerts and the resources you need to integrate them into your own monitoring setup.
See you soon!