


Product Updates
An Incremental Materialized View on Steroids: How We Made Continuous Aggregates Even Better
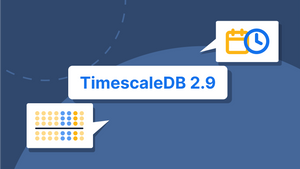
A continuous aggregate is similar to a PostgreSQL materialized view, speeding up queries. But rolling up (or downsampling) previously rolled up data can increase calculation speed while decreasing storage needs. Say hi to continuous aggregates on continuous aggregates, courtesy of TimescaleDB 2.9.


PostgreSQL
PostgreSQL + TimescaleDB: 1,000x Faster Queries, 90 % Data Compression, and Much More
TimescaleDB expands PostgreSQL query performance by 1,000x, reduces storage utilization by 90%, and provides time-saving features for time-series and analytical applications—while still being 100% Postgres.


Engineering
How We Made Data Aggregation Better and Faster on PostgreSQL With TimescaleDB 2.7
They’re so fast we can’t catch up! Check out our benchmarks with two datasets to learn how we used continuous aggregates to make queries up to 44,000x faster, while requiring 60 % less storage (on average).

Events & Recaps
Five Lessons for Managing Growth and Career Development in Software Companies
Managing career growth and development can be tricky, especially in fast-paced software companies. Drawing from personal experience, Timescale’s VP of Engineering shares five lessons for healthy and productive organizations.