Analyzing 5 Million NFT Sales on OpenSea using PostgreSQL
In this tutorial, we provide a step-by-step guide to collecting, storing, and analyzing NFT (non-fungible tokens) sales data from the largest NFT marketplace, OpenSea.
NFTs, like much of the data related to blockchains and cryptocurrencies, can seem complicated at first if you’re not already familiar with it, but in this tutorial we take you from zero to NFT hero and give you a foundation for analyzing NFT trends.
In this tutorial, you will:
- Design a schema for NFT transactions
- Ingest time-series NFT data and additional relevant relational data
- Query the dataset using PostgreSQL and TimescaleDB to unlock insights from the data
NFT Starter Kit
This tutorial is part of the Timescale NFT Starter Kit, designed to get you up and running with analyzing NFT data, and give you the inspiration to build your own, more complex projects. The NFT Starter Kit contains the following components:
- A data ingestion script, which collects real-time data from OpenSea and ingests it into TimescaleDB
- A sample dataset (to get started quickly, should you wish to not ingest real-time data)
- A schema for storing NFT sales, assets, collections and owners
- A local TimescaleDB database, pre-loaded with sample NFT data
- Pre-built dashboards and charts in Apache Superset and Grafana for visualizing your data analysis
- Queries to use as a starting point for your own analysis
To get started, clone the NFT Starter Kit GitHub repo and follow along with this tutorial.
Prerequisites
- Create a free Timescale account.
- Install psql or any other PostgreSQL client (e.g., DBeaver, PgAdmin).
The data used in this tutorial is downloaded using the OpenSea API /events endpoint. This API returns a wide range of data fields, including information about the assets, collections, prices, accounts, and several other fields related to the transactions. You can read their documentation here.
What’s an NFT?: A non-fungible token (NFT) is a unique digital asset representing ownership of a digital item stored on the blockchain. In this tutorial, we refer to NFTs as “assets.”
What’s an NFT collection?: An NFT collection is a group of related NFT items. They can be sold individually or in bundles.
Design Schema for NFT Transactions
A properly designed database schema is essential to efficiently store and analyze data. In this tutorial, we work with NFT time-series data that has multiple supporting relational tables.
To help you get familiar with NFT data, let’s consider some of the questions that could be answered with data:
- Which collections have the highest trading volume?
- What’s the number of daily transactions of a given collection/asset?
- Which collections have the most trading volume in Ether (ETH)?
- Which account made the most NFT trades?
- How are the mean and median sale prices correlated?
These are just some basic questions to get you thinking about what other useful insights can be found from an NFT dataset.
One theme which is consistent across all these questions is that most of the insights generated revolve around the sale itself or the aggregation of sales.
Hence, we need to create a schema which focuses on the time-series aspect of our data. We also want to make sure that JOINing supporting tables is easy to be able to make queries that touch both the time-series and the relational tables. Thanks to TimescaleDB’s PostgreSQL foundation and full-SQL support, we can easily combine time-series and relational tables during our analysis.
Tables and field descriptions
TimescaleDB hypertable:
nft_sales: successful NFT transactions
Relational tables (regular PostgreSQL tables):
assets: unique NFT itemscollections: NFT collectionsaccounts: NFT trading accounts/users
nft_sales
| Data field       | Description                     |
|------------------|---------------------------------|
| id               | OpenSea ID (unique)             |
| time             | Time of the sale                |
| asset_id         | ID of the NFT, FK: assets(id)   |
| collection_id    | ID of the collection this NFT belongs to, FK: collections(id))
| auction_type     | Auction type ('dutch', 'english', 'min_price') |
| contract_address | Address of the smart contract   |
| quantity         | NFT quantity sold               |
| payment_symbol   | Payment symbol (usually ETH, depends on the blockchain where the NFT is minted) |
| total_price      | Total price paid for the NFT    |
| seller_account   | Seller's account, FK: accounts(id) |
| from_account     | Account used to transfer from, FK: accounts(id) |
| to_account       | Account used to transfer to, FK: accounts(id) |
| winner_account   | Buyer's account, FK: accounts(id) |
- Holds information about successful sale transactions in time-series form
- One row represents one successful sale event on the OpenSea platform
idis a unique field provided by the OpenSea APItotal_priceis the price paid for the NFT(s) in ETH (or other cryptocurrency payment symbol available on OpenSea)quantityindicates how many NFTs were sold in the transaction (can be more than 1)auction_typeis NULL by default unless the transaction happened as part of an auctionasset_idandcollection_idfields can be used to JOIN the supporting relational tables
assets
| Data field       | Description                            |
|------------------|----------------------------------------|
| id               | OpenSea ID (PK)                        |
| name             | Name of the NFT                        |
| description      | Description of the NFT                 |
| contract_date    | Creation date of the smart contract    |
| url              | OpenSea URL of the NFT                 |
| owner_id         | ID of the NFT owner account, FK: accounts(id) |
| details          | Other extra data fields (JSONB)        |
- Contains information about the assets (NFTs) that have been in the transactions
- One row represents a unique NFT asset on the OpenSea platform
nameis the name of the NFT, not uniqueidis the primary key and provided by the OpenSea API- One asset can be referenced from multiple transactions (traded multiple times)
collections
| Data field       | Description               |
|------------------|---------------------------------|
| id               | Auto-increment (PK)             |
| slug             | Slug of the collection (unique) |
| name             | Name of the collection          |
| url              | OpenSea url of the collection   |
| details          | Other extra data fields (JSONB) |
- Holds information about the NFT collections.
- One row represents a unique NFT collection
- One collection includes multiple unique NFTs (that are in the
assetstable) slugis a unique identifier of the collection
accounts
| Data field       | Description               |
|------------------|---------------------------------|
| id               | Auto-increment (PK)             |
| user_name        | OpenSea user name               |
| address          | Account address, unique         |
| details          | Other extra data fields (JSONB) |
- This table includes the accounts that have participated in at least one transaction from the
nft_salestable. - One row represents one unique account on the OpenSea platform
addressis never NULL and it’s uniqueuser_nameis NULL unless it’s been submitted on the OpenSea profile by the user
Schema
The data types used in the schema have been determined based on our research and hands-on experience working with the OpenSea API and the data pulled from OpenSea. First, let’s run the following SQL commands to create the schema (you can also download and run the schema.sql file from our NFT Starter Kit GitHub repository.
CREATE TABLE collections (
   id BIGINT PRIMARY KEY GENERATED ALWAYS AS IDENTITY,
   slug TEXT UNIQUE,
   name TEXT,
   url TEXT,
   details JSONB
);

CREATE TABLE accounts (
   id BIGINT PRIMARY KEY GENERATED ALWAYS AS IDENTITY,
   user_name TEXT,
   address TEXT UNIQUE NOT NULL,
   details JSONB
);

CREATE TABLE assets (
   id BIGINT PRIMARY KEY,
   name TEXT,
   collection_id BIGINT REFERENCES collections (id), -- collection
   description TEXT,
   contract_date TIMESTAMP WITH TIME ZONE,
   url TEXT UNIQUE,
   img_url TEXT,
   owner_id BIGINT REFERENCES accounts (id), -- account
   details JSONB
);

CREATE TYPE auction AS ENUM ('dutch', 'english', 'min_price');
CREATE TABLE nft_sales (
   id BIGINT,
   "time" TIMESTAMP WITH TIME ZONE,
   asset_id BIGINT REFERENCES assets (id), -- asset
   collection_id BIGINT REFERENCES collections (id), -- collection
   auction_type auction,
   contract_address TEXT,
   quantity NUMERIC,
   payment_symbol TEXT,
   total_price DOUBLE PRECISION,
   seller_account BIGINT REFERENCES accounts (id), -- account
   from_account BIGINT REFERENCES accounts (id), -- account
   to_account BIGINT REFERENCES accounts (id), -- account
   winner_account BIGINT REFERENCES accounts (id), -- account
   CONSTRAINT id_time_unique UNIQUE (id, time)
);

SELECT create_hypertable('nft_sales', 'time');

CREATE INDEX idx_asset_id ON nft_sales (asset_id);
CREATE INDEX idx_collection_id ON nft_sales (collection_id);
CREATE INDEX idx_payment_symbol ON nft_sales (payment_symbol);
Some notes on schema design
BIGINT’s storage size is 8 bytes in PostgreSQL (as opposed to INT’s 4 bytes) which is needed to make sure it doesn’t overflow.
For the quantity field we suggest using numeric or decimal (which works the same way in PostgreSQL) as the data type, because in some edge cases we experience transactions where the quantity was too big even for BIGINT.
total_price needs to be double precision because NFT prices often include many decimals, especially in the case of Ether (ETH) and similar cryptocurrencies which are infinitely divisible (functionally speaking).
We created an ENUM for auction_type as this value can only be 'dutch', 'english', or 'min_price', representing the different types of auctions used to sell an NFT.
We decided to not store all the data fields that are available from the OpenSea API, only those that we deem interesting or useful for future analysis. But still, we wanted to keep all of the unused data fields somewhat close, so we added a details JSONB column to each relational table that contains additional information about the record - e.g., it has background_color as a field for the assets.
Note: In our sample dataset provided below, we chose not to include the JSONB data so as to keep the size of the dataset low.
Now that we’ve defined our database schema and created the tables, let’s ingest some data to analyze.
Ingest NFT data
Now that you have your database and schema created, let’s ingest some data to play with! You have two options to ingest NFT data for this tutorial:
- Option 1: Ingest real-time data: You can use the script
ingest.pyincluded in the starter kit repo on GitHub, that will connect to the OpenSea API and fetch the latest data (no API key required at the time of writing!). You can download and run the ingestion script here. Before running the script, please replace the following parameters with the connection details for your TimescaleDB database:
DB_NAME="tsdb"
HOST="YOUR_HOST_URL"
USER="tsdbadmin"
PASS="YOUR_PASSWORD_HERE"
PORT="PORT_NUMBER"
To run the ingestion script, create a new python virtual environment and install the requirements first:
virtualenv env && source env/bin/activate
pip install -r requirements.txt
Then finally, run the Python script:
python3 ingest.py
- Option 2: Download sample data: Alternatively, you can download and insert a [CSV file containing one week of sample data] (https://assets.timescale.com/docs/downloads/nft_sample.zip ) (sales from 1 October 2021 to 7 October 2021) in order to get started with quickly and then set up the real-time data ingestion later.
Download the CSV files here: nft_sample_data.zip
To insert the CSV file into your database, first connect to the database
psql -x "postgres://host:port/tsdb?sslmode=require"
Tip: If you’re using Timescale Cloud, simply follow the instructions under “How to Connect” which will give you a customized command to run to connect directly to your database.
Uncompress the ZIP file, then import the CSV files in this order (it can take a few minutes in total):
\copy accounts FROM 001_accounts.csv CSV HEADER;
\copy collections FROM 002_collections.csv CSV HEADER;
\copy assets FROM 003_assets.csv CSV HEADER;
\copy nft_sales FROM 004_nft_sales.csv CSV HEADER;
Analyze NFT data
Now that you’ve successfully collected and ingested the data, it’s time to analyze it. For this analysis, we use data collection via our ingestion script containing only successful sale transactions that happened from 1 January 2021 to 12 October 2021 on the OpenSea marketplace, as reported by the OpenSea API.
For simplicity, this tutorial analyzes only those that used ‘ETH’ as their payment symbol. (You’re welcome to modify the script to include more payment symbols in your own analysis.)
All the queries below, plus some additional ones can be found in out NFT Starter Kit on GitHub in the file queries.sql.
We divide our analysis into two parts: simple queries and complex queries. But first, we will create something to speed up our queries: TimescaleDB continuous aggregates.
Speeding Up Queries With Continuous Aggregates
TimescaleDB continuous aggregates speed up workloads that need to process large amounts of data. They look like PostgreSQL materialized views, but have a built-in refresh policy that makes sure that the data is up to date as new data comes in. In addition, the refresh procedure is careful to only refresh data in the materialized view that actually needs to be changed, thereby avoiding recomputation of data that did not change. This smart refresh procedure massively improves the refresh performance of the materialized view and the refresh policy ensures that the data is always up to date.
Continuous aggregates are often used to speed up dashboards and visualizations, summarizing data sampled at high frequency and querying downsampled data over long time periods.
In our analysis, we’ll create two continuous aggregates to speed up queries on collections and on assets:
Collections
The collections_daily continuous aggregate will compute and store the following information about all collections for each day: daily average price, median price, sale volume, ETH volume, the most expensive NFT, the highest price.
/* Collection caggs */
CREATE MATERIALIZED VIEW collections_daily
WITH (timescaledb.continuous) AS
SELECT
collection_id,
time_bucket('1 day', time) AS bucket,
mean(percentile_agg(total_price)) AS mean_price,
approx_percentile(0.5, percentile_agg(total_price)) AS median_price,
COUNT(*) AS volume,
SUM(total_price) AS volume_eth,
LAST(asset_id, total_price) AS most_expensive_nft_id,
MAX(total_price) AS max_price
FROM nft_sales
GROUP BY bucket, collection_id;


SELECT add_continuous_aggregate_policy('collections_daily',
    start_offset => INTERVAL '3 days',
    end_offset => INTERVAL '1 day',
    schedule_interval => INTERVAL '1 day');
When asking questions about where daily activity is our time period of concern, we will query the continuous aggregate rather than the raw data in the nft_sales hypertable.
Assets
The assets_daily continuous aggregate will compute and store the following information about all assets for each day: asset_id, the collection it belongs to, daily average price, median price, sale volume, ETH volume, open, high, low, and close (OHLC) prices.
/* Asset caggs */
CREATE MATERIALIZED VIEW assets_daily
WITH (timescaledb.continuous) AS
SELECT time_bucket('1 day', time) AS bucket,
asset_id,
collection_id,
mean(percentile_agg(total_price)) AS mean_price,
approx_percentile(0.5, percentile_agg(total_price)) AS median_price,
COUNT(*) AS volume,
SUM(total_price) AS volume_eth,
FIRST(total_price, time) AS open_price,
MAX(total_price) AS high_price,
MIN(total_price) AS low_price,
LAST(total_price, time) AS close_price
FROM nft_sales
WHERE payment_symbol = 'ETH'
GROUP BY bucket, asset_id, collection_id
HAVING COUNT(*) > 1;
We also added a refresh policy to update the continuous aggregate daily with the latest data, so that we can save computation at query time:
SELECT add_continuous_aggregate_policy('assets_daily',
    start_offset => INTERVAL '3 days',
    end_offset => INTERVAL '1 day',
    schedule_interval => INTERVAL '1 day');
Simple Queries
We’ll start our analysis by asking simple questions about NFT sales in 2021 and answering them using SQL queries. These queries are meant to serve as a starting point for your own analysis. Feel free to modify each query to analyze the time period, asset, collection, or account you are curious about!
Where possible, we include dashboard examples in Superset and Grafana to serve as inspiration for creating your own dashboard which monitors and analyzes NFT sales using free, open-source tools! You can find the code used to create each graph in the NFT Starter Kit GitHub repo.
Collections with the highest sale volume
Which collections have the highest volume of sales? Answering this is a great starting point for finding collections with assets that are frequently traded, which is important for buyers thinking about the resale value of their NFTs. If you buy an NFT in one of the collections below, chances are you’ll be able to find a buyer. In the query below, we order the collections by the total volume of sales, but you could also order them by ETH volume instead.
/* Collections with the highest volume?
*/
SELECT
slug,
SUM(volume) total_volume,
SUM(volume_eth) total_volume_eth
FROM collections_daily cagg
INNER JOIN collections c ON cagg.collection_id = c.id
GROUP BY cagg.collection_id, slug
ORDER BY total_volume DESC;

| slug               | total_volume | total_volume_eth   |
|--------------------|--------------|--------------------|
| sorare             | 339776       | 35113.062124036835 |
| rarible            | 87594        | 41663.18012651946  |
| art-blocks-factory | 45861        | 43607.73207320631  |
| axie               | 43074        | 6692.242340266918  |
| cryptokitties      | 41300        | 5560.907800845506  |
| parallelalpha      | 36892        | 31212.686399159273 |
| art-blocks         | 35976        | 199016.27793424827 |
| ape-gang           | 25782        | 4663.009300672081  |
| 24px               | 24872        | 3203.9084810874024 |
| pudgypenguins      | 24165        | 35949.81731415086  |
For this query, we take advantage of the pre-calculated data about collections stored in the collections_daily continuous aggregate. We also perform an INNER JOIN on both the collections and assets relational tables to find the collection name in human readable form, represented by the slug.
Querying from continuous aggregates is more performant and allows us to write shorter, more readable queries. It is a pattern we’ll use again in the queries below, so look out for it!
Daily sales of a collection
How many sales took place each day for a certain collection? In the query below, we look at the daily volume of sales for NFTs in the cryptokitties collection. This can help us find which days the NFT traders have been more active and help us spot patterns about which days of the week or month have higher or lower volume and why.
Feel free to modify it to look at your favorite NFT collection, be it cryptopunks, lazy-lions, or afrodroids-by-owo.
SELECT bucket, slug, volume
FROM collections_daily cagg
INNER JOIN collections c ON cagg.collection_id = c.id
WHERE slug = 'cryptokitties'
ORDER BY bucket DESC;

bucket             |slug         |volume|
-------------------+-------------+------+
2021-10-12 02:00:00|cryptokitties|    48|
2021-10-11 02:00:00|cryptokitties|    61|
2021-10-10 02:00:00|cryptokitties|    84|
2021-10-09 02:00:00|cryptokitties|    73|
2021-10-08 02:00:00|cryptokitties|    56|
...
Here’s what this query would look like as a time-series chart in Apache Superset:
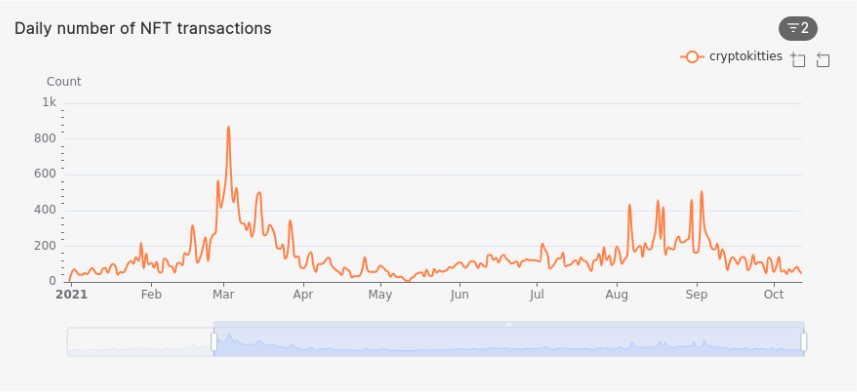
As a reminder, charts like this are pre-built and ready for you to use and modify as part of the pre-built dashboards in our NFT Starter Kit.
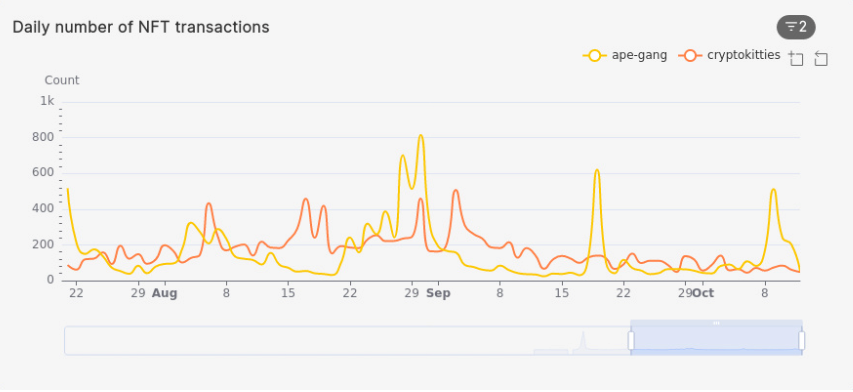
Comparison of daily NFT sales for different collections
How do the daily sales of NFTs in one collection compare to that of another collection? In the query below, we compare the daily sales of two popular NFT collections: CryptoKitties and Ape Gang, in the past three months:
/* Daily number of NFT transactions, "CryptoKitties" vs Ape Gang from past 3 months? */
SELECT bucket, slug, volume
FROM collections_daily cagg
INNER JOIN collections c ON cagg.collection_id = c.id
WHERE slug IN ('cryptokitties', 'ape-gang') AND bucket > NOW() - INTERVAL '3 month'
ORDER BY bucket DESC, slug;


bucket             |slug         |volume|
-------------------+-------------+------+
2021-10-12 02:00:00|ape-gang     |    58|
2021-10-12 02:00:00|cryptokitties|    48|
2021-10-11 02:00:00|ape-gang     |   208|
2021-10-11 02:00:00|cryptokitties|    61|
2021-10-10 02:00:00|ape-gang     |   248|
2021-10-10 02:00:00|cryptokitties|    84|
...
This sort of query is useful to track sale activity in collections you’re interested in or own assets in, so you can see the activity of other NFT holders. Moreover, you can modify the time period under consideration to look at larger (e.g., nine months) or smaller periods of time (e.g.,14 days).
Snoop Dogg's NFT activity (aka Individual account activity)
How many NFTs did a particular person buy in a certain period of time? This sort of query is useful to monitor the activity of popular NFT collectors, like American rapper Snoop Dogg (aka Cozomo_de_Medici) or African NFT evangelist Daliso Ngoma, or even compare trading patterns of multiple collectors. Since NFT transactions are public on the Ethereum blockchain and our database contains seller (seller_account) and buyer(winner_account) columns as well, we can analyze the purchase activity of a specific account.
In the query below, we chose Snoop Dogg’s address to analyze his trades, but feel free to add any address in the WHERE clause to see the specified account’s transactions.
/* Snoop Dogg's transactions in the past 3 months aggregated */
WITH snoop_dogg AS (
    SELECT id FROM accounts
    WHERE address = '0xce90a7949bb78892f159f428d0dc23a8e3584d75'
)
SELECT
COUNT(*) AS trade_count,
COUNT(DISTINCT asset_id) AS nft_count,
COUNT(DISTINCT collection_id) AS collection_count,
COUNT(*) FILTER (WHERE seller_account = (SELECT id FROM snoop_dogg)) AS sale_count,
COUNT(*) FILTER (WHERE winner_account = (SELECT id FROM snoop_dogg)) AS buy_count,
SUM(total_price) AS total_volume_eth,
AVG(total_price) AS avg_price,
MIN(total_price) AS min_price,
MAX(total_price) AS max_price
FROM nft_sales
WHERE payment_symbol = 'ETH' AND ( seller_account = (SELECT id FROM snoop_dogg) OR winner_account = (SELECT id FROM snoop_dogg) )
AND time > NOW()-INTERVAL '3 months'


trade_count|nft_count|collection_count|sale_count|buy_count|total_volume_eth  |avg_price         |min_price|max_price|
-----------+---------+----------------+----------+---------+------------------+------------------+---------+---------+
        59|       57|              20|         1|       58|1835.5040000000006|31.110237288135604|      0.0|   1300.0|
From the result of the query, we can see that Snoop Dogg made 59 trades overall in the past three months (bought 58 times and sold only once). His trades included 57 individual NFTs and 23 collections, totaling 1835.504 ETH spent, with the minimum paid price of zero and max of 1,300 ETH. Important to note again here that this query only includes transactions that are reachable from the OpenSea API and doesn’t include purchases on other platforms.
Most expensive asset in a collection
What’s the most expensive NFT in a certain collection? In this query, we look at a specific collection (CryptoKitties) and find the most expensive NFT sold from it. This can help you find the rarest items in a collection and look at the properties that make it rare in order to help you buy items with similar properties from that collection.
/* Top 5 most expensive NFTs in the CryptoKitties collection */
SELECT a.name AS nft, total_price, time, a.url FROM nft_sales s
INNER JOIN collections c ON c.id = s.collection_id
INNER JOIN assets a ON a.id = s.asset_id
WHERE slug = 'cryptokitties' AND payment_symbol = 'ETH'
ORDER BY total_price DESC
LIMIT 5
nft |total_price|time |url |
---------------+-----------+-------------------+-----------------------------------------------------------------------+
Founder Cat #40| 225.0|2021-09-03 14:59:16|https://opensea.io/assets/0x06012c8cf97bead5deae237070f9587f8e7a266d/40|
Founder Cat #17| 177.0|2021-09-03 01:58:13|https://opensea.io/assets/0x06012c8cf97bead5deae237070f9587f8e7a266d/17|
润龙🐱👓创世猫王44# | 150.0|2021-09-03 02:01:11|https://opensea.io/assets/0x06012c8cf97bead5deae237070f9587f8e7a266d/44|
grey | 149.0|2021-09-03 02:32:26|https://opensea.io/assets/0x06012c8cf97bead5deae237070f9587f8e7a266d/16|
Founder Cat #38| 148.0|2021-09-03 01:58:13|https://opensea.io/assets/0x06012c8cf97bead5deae237070f9587f8e7a266d/38|
Daily ETH volume of assets in a collection
What is the daily volume of Ether (ETH) for a specific collection? Using the example of CryptoKitties, the query below calculates the daily total ETH spent in sales of NFTs in a certain collection:
/* Daily ETH volume of CryptoKitties NFT transactions? */
SELECT bucket, slug, volume_eth
FROM collections_daily cagg
INNER JOIN collections c ON cagg.collection_id = c.id
WHERE slug = 'cryptokitties'
ORDER BY bucket DESC;

bucket             |slug         |volume_eth         |
-------------------+-------------+-------------------+
2021-10-12 02:00:00|cryptokitties| 1.6212453906698892|
2021-10-11 02:00:00|cryptokitties| 1.8087566697786246|
2021-10-10 02:00:00|cryptokitties|  2.839395250444516|
2021-10-09 02:00:00|cryptokitties|  4.585460691370447|
2021-10-08 02:00:00|cryptokitties|   5.36784615406771|
2021-10-07 02:00:00|cryptokitties| 16.591879406085422|
2021-10-06 02:00:00|cryptokitties| 11.390538587035808|
2021-10-05 02:00:00|cryptokitties| 2.6664436389605375|
2021-10-04 02:00:00|cryptokitties|  1.277743749675905|
2021-10-03 02:00:00|cryptokitties|   8.21836121040045|
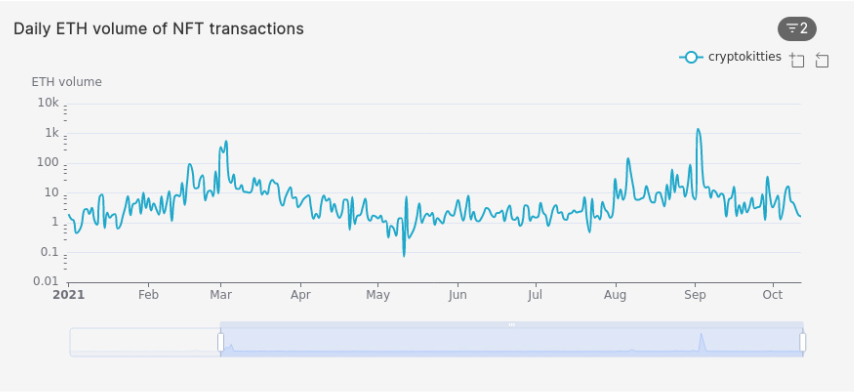
Note: for readability, the graph above uses a logarithmic scale, which we configured in the graph settings in Superset.
Comparison of daily ETH volume of multiple collections
How does the daily volume of ETH spent on assets in one collection compare to others? We use the query below to answer that question, using CryptoKitties and Ape Gang as examples, finding the daily ETH spent on buying assets in those collections in the past three months. You can extend this query to monitor and compare the daily volume spent on your favorite NFT collections and find patterns in sales.
/* Daily ETH volume of NFT transactions: CryptoKitties vs Ape Gang? */
SELECT bucket, slug, volume_eth
FROM collections_daily cagg
INNER JOIN collections c ON cagg.collection_id = c.id
WHERE slug IN ('cryptokitties', 'ape-gang') AND bucket > NOW() - INTERVAL '3 month'
ORDER BY bucket, slug DESC;

bucket             |slug         |volume_eth        |
-------------------+-------------+------------------+
2021-10-12 02:00:00|ape-gang     | 54.31030000000001|
2021-10-12 02:00:00|cryptokitties|1.6212453906698896|
2021-10-11 02:00:00|ape-gang     |205.19786218340954|
2021-10-11 02:00:00|cryptokitties|1.8087566697786257|
2021-10-10 02:00:00|ape-gang     | 240.0944201232798|
2021-10-10 02:00:00|cryptokitties| 2.839395250444517|
...
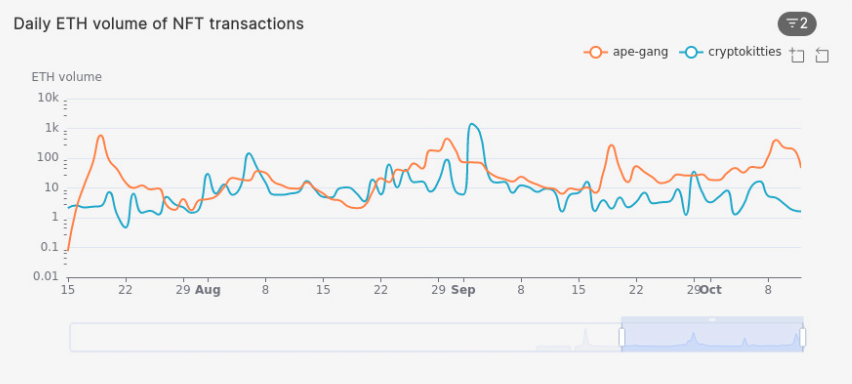
Note: The Y axis of the graph above is a logarithmic scale used for readability purposes.
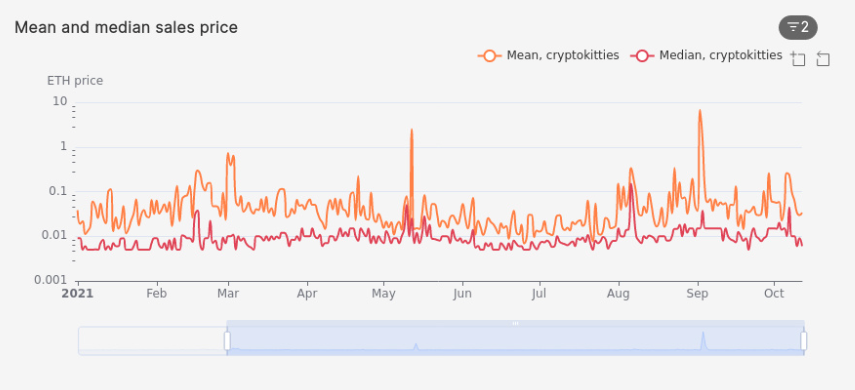
Daily mean vs median sale price of assets in a collection
When analyzing the daily price of assets in a specific collection, two useful statistics to use are the mean price and the median price. In the query below, we analyze the daily mean and median sale prices of assets in the CryptoKitties collection.
/* Mean vs median sale price of CryptoKitties? */
SELECT bucket, slug, mean_price, median_price
FROM collections_daily cagg
INNER JOIN collections c ON cagg.collection_id = c.id
WHERE slug = 'cryptokitties'
ORDER BY bucket DESC;

bucket             |slug         |mean_price          |median_price         |
-------------------+-------------+--------------------+---------------------+
2021-10-12 02:00:00|cryptokitties| 0.03377594563895602|  0.00600596459124994|
2021-10-11 02:00:00|cryptokitties|0.029651748684895486| 0.008995758681494385|
2021-10-10 02:00:00|cryptokitties| 0.03380232441005376|  0.00600596459124994|
2021-10-09 02:00:00|cryptokitties| 0.06281453001877325| 0.010001681651251936|
2021-10-08 02:00:00|cryptokitties| 0.09585439560835196| 0.010001681651251936|
Since calculating the mean and median are computationally expensive for large datasets, we use the percentile_agg hyperfunction, a SQL function that is part of the Timescale Toolkit extension. It accurately approximates both statistics, as shown in the definition of mean_price and median_price in the continuous aggregate we created earlier in the tutorial:
CREATE MATERIALIZED VIEW collections_daily
WITH (timescaledb.continuous) AS
SELECT
collection_id,
time_bucket('1 day', time) AS bucket,
mean(percentile_agg(total_price)) AS mean_price,
approx_percentile(0.5, percentile_agg(total_price)) AS median_price,
COUNT(*) AS volume,
SUM(total_price) AS volume_eth,
LAST(asset_id, total_price) AS most_expensive_nft,
MAX(total_price) AS max_price
FROM nft_sales s
GROUP BY bucket, collection_id;

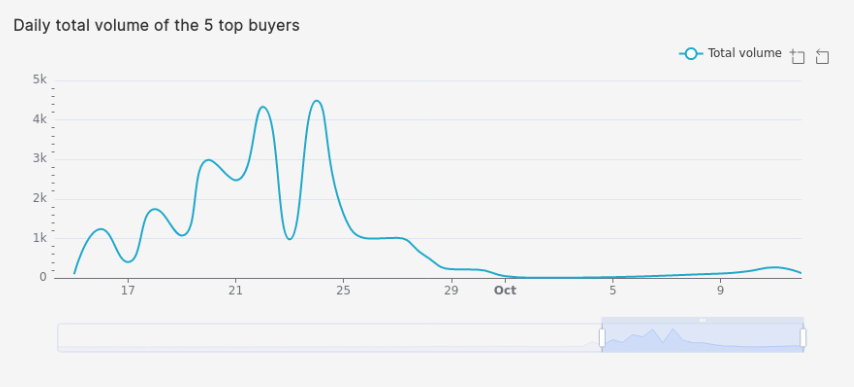
Daily total volume of top buyers
What days do the most prolific accounts buy on? To try answer that question, let’s analyze the top 5 NFT buyer accounts - based on the number of NFT purchases - and their total daily volume of NFT bought over time. This is a good starting point to dig deeper into analysis, as it can help you find days when something happened that made these users buy a lot of NFTs, for example: dips in ETH prices, leading to lower gas fees, or drops of high anticipated collections.
/* Daily total volume of the 5 top buyers */
WITH top_five_buyers AS (
   SELECT winner_account FROM nft_sales
   GROUP BY winner_account
   ORDER BY count(*) DESC
   LIMIT 5
)
SELECT time_bucket('1 day', time) AS bucket, count(*) AS total_volume FROM nft_sales
WHERE winner_account IN (SELECT winner_account FROM top_five_buyers)
GROUP BY bucket
ORDER BY bucket DESC
Complex Queries
Let’s take a look at some more complex questions we could ask about our dataset, as well as more complex queries to retrieve interesting things from our NFT dataset.
Calculating 30-min mean and median sale prices of highest trade count NFT from yesterday
What is the mean and median sales prices of the highest traded NFT from the past day, in 30-minute intervals?
/* Calculating 15-min mean and median sale prices of highest trade count NFT on 2021-10-17 */
WITH one_day AS (
   SELECT time, asset_id, total_price FROM nft_sales
   WHERE DATE(time) = '2021-10-17' AND payment_symbol = 'ETH'
)
SELECT time_bucket('30 min', time) AS bucket,
assets.name AS nft,
mean(percentile_agg(total_price)) AS mean_price,
approx_percentile(0.5, percentile_agg(total_price)) AS median_price
FROM one_day
INNER JOIN assets ON assets.id = one_day.asset_id
WHERE asset_id = (SELECT asset_id FROM one_day GROUP BY asset_id ORDER BY count(*) DESC LIMIT 1)
GROUP BY bucket, nft
ORDER BY bucket DESC;

bucket             |nft           |mean_price         |median_price        |
-------------------+--------------+-------------------+--------------------+
2021-10-17 23:30:00|Zero [Genesis]|               0.06| 0.06002456177152414|
2021-10-17 23:00:00|Zero [Genesis]|              0.118|  0.1180081944620535|
2021-10-17 22:30:00|Zero [Genesis]|       0.0785333333| 0.06002456177152414|
2021-10-17 22:00:00|Zero [Genesis]|             0.0775| 0.09995839119153871|
2021-10-17 21:30:00|Zero [Genesis]|             0.0555| 0.05801803032917102|
This is a more complex query which uses PostgreSQL Common Table Expressions (CTE) to first create a sub-table of the data from the past day, called one_day. Then we use the hyperfunction time_bucket to create 30-minute buckets of our data and use the percentile_agg hyperfunction to find the mean and median prices for each interval period. Finally, we JOIN on the assets table to get the name of the specific NFT in order to return it along with the mean and median price for each time interval.
Daily OHLCV data per asset
Open-high-low-close-volume (OHLCV) charts are most often used to illustrate the price of a financial instrument, most commonly stocks, over time. We might want to create OHLCV charts for a single NFT or get the OHLCV values for a set of NFTs.
The query below finds the OHLCV for NFTs with more than 100 sales in a day, as well as the day on which the trades occurred:
/* Daily OHLCV per asset */
SELECT time_bucket('1 day', time) AS bucket, asset_id,
FIRST(total_price, time) AS open_price, LAST(total_price, time) AS close_price,
MIN(total_price) AS low_price, MAX(total_price) AS high_price,
count(*) AS volume
FROM nft_sales
WHERE payment_symbol = 'ETH'
GROUP BY bucket, asset_id
HAVING count(*) > 100
ORDER BY bucket
LIMIT 5;

bucket             |asset_id|open_price|close_price|low_price  |high_price|volume|
-------------------+--------+----------+-----------+-----------+----------+------+
2021-02-03 01:00:00|17790698|      0.56|       1.25|       0.07|       7.0|   148|
2021-02-05 01:00:00|17822636|       7.0|        0.7|        0.7|       8.4|   132|
2021-02-11 01:00:00|17927258|       0.8|        0.2|        0.1|       2.0|   103|
2021-02-26 01:00:00|18198072|       0.1|        0.1|        0.1|       0.1|   154|
2021-02-26 01:00:00|18198081|      0.25|       0.25|       0.25|      0.25|   155|
In the query above, we use the TimescaleDB hyperfunctions first() and last() to find the open and close prices respectively. These hyperfunctions enable you to find the value of one column as ordered by another, by performing a sequential scan through their groups, in this case we get the first and last values of the total_price column, as ordered by the time column. See the docs for more information.
If this is a query you would want to regularly run, it makes sense to create a continuous aggregate which improves query performance tremendously.
Moreover, you can remove the LIMIT 5 and replace it with an additional WHERE clause filtering for a specific time-period to make the query more useful.
Assets with the biggest intraday price change
Which assets had the biggest intraday sale price change? We often want to identify interesting behaviour such as an asset being bought and then sold again for a much higher (or lower) amount within the same day. This can help us identify good “flips” of NFTs or perhaps owners whose brand elevated the NFT price thanks to it being part of their collection.
The query below finds the assets with the biggest intraday sale price change in the last six months:
/* Daily assets sorted by biggest intraday price change in the last 6 month*/
SELECT time_bucket('1 day', time) AS bucket, a.name AS nft, a.url,
FIRST(total_price, time) AS open_price, LAST(total_price, time) AS close_price,
MAX(total_price)-MIN(total_price) AS intraday_max_change
FROM nft_sales s
INNER JOIN assets a ON a.id = s.asset_id
WHERE payment_symbol = 'ETH' AND time > NOW() - INTERVAL '6 month'
GROUP BY bucket, asset_id, a.name, a.url
ORDER BY intraday_max_change DESC
LIMIT 5;

bucket             |nft           |url                                                                           |open_price|close_price|intraday_max_change|
-------------------+--------------+------------------------------------------------------------------------------+----------+-----------+-------------------+
2021-09-22 02:00:00|Page          |https://opensea.io/assets/0xa7206d878c5c3871826dfdb42191c49b1d11f466/1        |      0.72|     0.9999|           239.2889|
2021-09-23 02:00:00|Page          |https://opensea.io/assets/0xa7206d878c5c3871826dfdb42191c49b1d11f466/1        |    0.9999|       1.14|              100.0|
2021-09-27 02:00:00|Skulptuur #647|https://opensea.io/assets/0xa7d8d9ef8d8ce8992df33d8b8cf4aebabd5bd270/173000647|      25.0|       90.0|               65.0|
2021-09-25 02:00:00|Page          |https://opensea.io/assets/0xa7206d878c5c3871826dfdb42191c49b1d11f466/1        |      1.41|      1.475|               61.3|
2021-09-26 02:00:00|Page          |https://opensea.io/assets/0xa7206d878c5c3871826dfdb42191c49b1d11f466/1        |      1.48|      4.341|              43.05|
Resources and Next Steps
As a reminder, the Starter Kit contains the following components:
- A data ingestion script, which collects real-time data from OpenSea and ingests it into TimescaleDB.
- A sample dataset (to get started quickly, should you wish to not ingest real-time data)
- A schema for storing NFT sales, assets, collections, and owners
- A local TimescaleDB database, pre-loaded with sample NFT data
- Pre-built dashboards and charts in Apache Superset and Grafana for visualizing your data analysis
- Queries to use as a starting point for your own analysis
Learn more about how to use TimescaleDB to store and analyze crypto data:
- Analyze cryptocurrency market data
- Analyzing Analyzing Bitcoin, Ethereum, and 4100+ other cryptocurrencies using PostgreSQL and TimescaleDB
- Learn how TimescaleDB user Messari uses data to open the crypto economy to everyone
- How one TimescaleDB user built a successful crypto trading bot