How Density Manages Large Real Estate Portfolios Using TimescaleDB
This is an installment of our “Community Member Spotlight” series, where we invite our customers to share their work, shining a light on their success and inspiring others with new ways to use technology to solve problems.
In this edition, part of the team at Density—Shane Steidley, director of software, and Brock Friedrich, software engineer—explain how they are using TimescaleDB to query data from IoT devices to help companies with substantial real estate footprints make data-driven decisions to optimize their real estate usage while reducing carbon emissions.
About the Company
Shane: Density builds technology that helps companies understand how people use physical space. Founded in 2014, our platform provides workplace analytics enabled by custom-built sensors which capture the complexities of how people move through and use space without invading privacy. These sensors feed raw data to Density’s analytics platform—a fast, data-rich system that provides comprehensive insights into how spaces are used, allowing companies to easily compare a space's performance against its intended purpose, another space, or portfolio benchmarks.
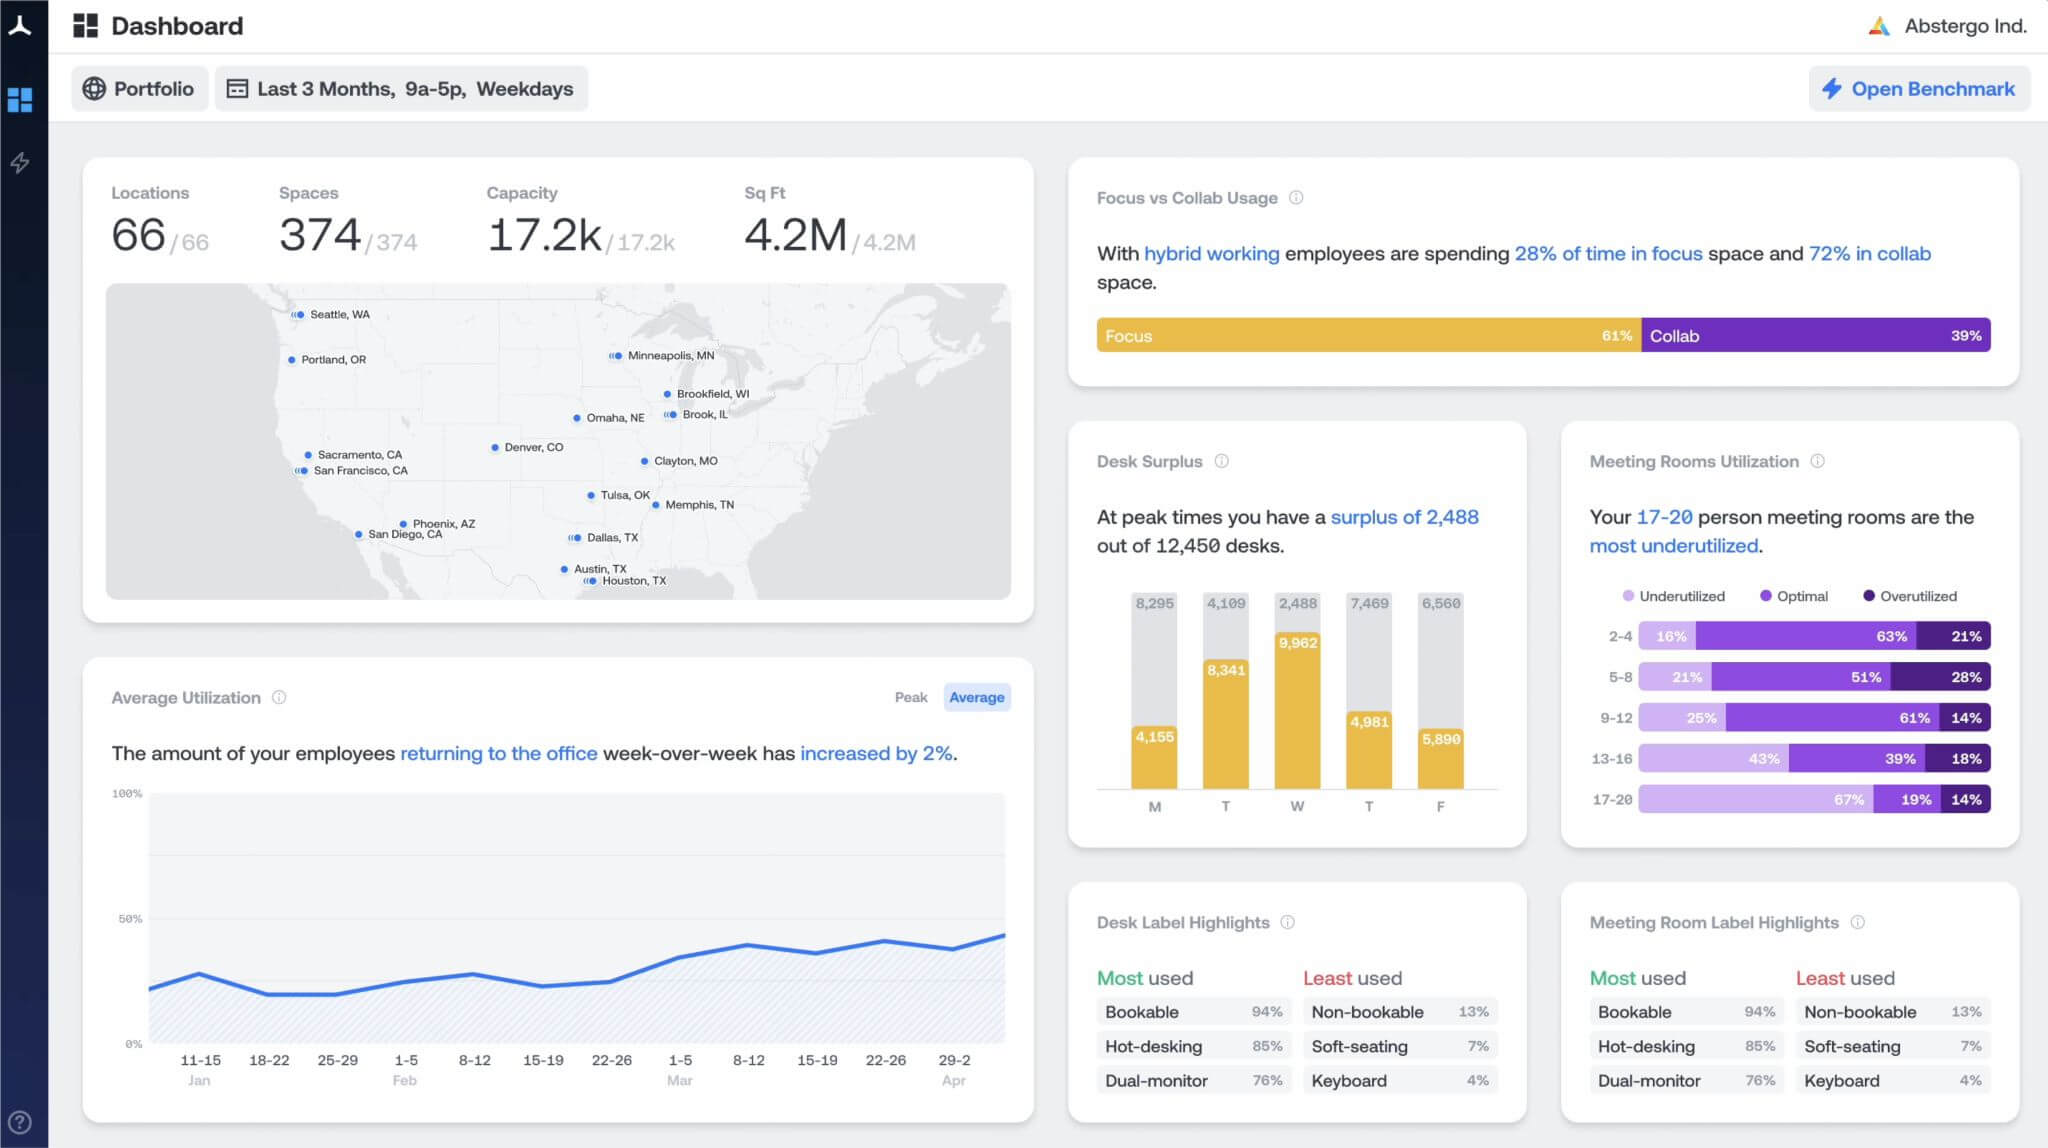
The platform can reveal if employees are choosing focus space or collaborative space, which floors are the most popular (and why), and how one office’s occupancy rate compares to others in a portfolio or against industry benchmarks. Today, our technology is helping inform decisions for the workplaces of some of the largest companies in the world, spanning 32 countries, with more than 1.25 billion square feet under management. Our growing list of customers ranges from Fortune 100 to high-growth tech companies that see the value in understanding the performance of their office spaces to lower operational costs, improve employee experience, and reduce their carbon footprint.
Our ultimate mission is to measure and improve humanity’s footprint on the world—optimizing commercial real estate portfolios is just the first step. Thirty-nine percent of CO2 emissions are directly or indirectly linked to real estate construction, so if we can help companies measure and optimize their use of real estate, we can have an outsized impact on the different issues that are impacting climate.

With Density, customers can understand how their space is used and right-size it. When we started, we needed to sell the problem and then sell our solution. Post-COVID, everybody understands the problem and the data that they could have access to, and how Density can provide value.
Brock: Density also provides that value while maintaining the anonymity of each person that walks underneath our sensors.
Shane: Privacy is very important to us; it’s one of our core tenets. And because of this, we don’t use cameras—we use other sensor types, namely infrared and radar, that don’t capture any personally identifiable information (PII).
About the Team
Shane: Density was born out of a web development consultancy. The consultancy founders got tired of walking to their favorite coffee shop during the cold, harsh winter in upstate New York only to find a long line. This unpleasant experience gave them the idea to create an occupancy sensor.
As you might expect, given the company’s origin, the Density engineering team started with 4-5 engineers with a heavy web development background. We have since grown our engineering team into a team capable of performing what I call true full-stack development. We have an electrical engineering team that designs our hardware and lays out the boards, and our devices are manufactured in Syracuse, NY, where we also have an R&D lab. Our team includes experts in mechanical design and embedded software, and we now have a backend system with multiple pipelines (whose data typically ends up in TimescaleDB) and multiple React-based frontend applications.
Brock: As a team, there are many different daily routines. It’s a mix of running production systems like Shane mentioned, live data pipelines, running historical analysis, or writing new features.
Shane: And we’re hiring! If you are interested in joining the Density Team, please check out our jobs page!
About the Project
Shane: We use different types of data at different stages. Our entry sensors generate infrared data that is very dense. It’s not feasible to send this dense data to the cloud, so we have to do all processing and machine learning at the edge (on the device). The results of this edge processing are +1/-1 counts that can be aggregated in our pipelines and TimescaleDB.
Our radar-based sensors generate sparse data, so we do less processing at the edge and more processing in the backend. That data has to go through a pipeline and get transformed before it makes sense to insert it into TimescaleDB and perform any aggregations. TimescaleDB really provides value when it comes to querying the data, allowing customers to slice the data up in multiple dimensions. That is something that just wasn’t easy before we started using TimescaleDB.

Brock: Yeah, to tack onto that, in TimescaleDB we store counts of people in spaces over time, and a wealth of derivative metrics off of those people counts, things like how long were people in spaces, not specific people, but how long was what we call dwell time? How long was this space used continuously, or what was its usage compared to similar space types throughout the day?
One of the parts I think Shane was trying to highlight is that there's a real dynamism to how those queries can take shape in that they can be sliced and diced and composed in a more or less arbitrary number of ways. And TimescaleDB’s flexibility—it is built on a relational model at the end of the day—and its ability to do the partitioning under the covers and the hypertables to let us access all of the data back in time very quickly is the magic combination that we were looking for in a time-series database to meet our use case.
Choosing (and Using!) TimescaleDB
Brock: I found out about Timescale back in a previous life, circa early 2019. I worked for an oil and gas firm and was doing a lot of research into time-series storage and the options available in that space because we were developing a data software solution for supervisory control and data acquisition. Essentially, it boiled down to real-time remote sensing and monitoring for industrial controls.
During that research, I happened across TimescaleDB, which was still pretty early on. It was right about the time continuous aggregates came out, which was one of the big selling points for me. So when I came to Density, they were just beginning to evaluate options for time-series databases for our applications. I was able to contribute my previous experience with TimescaleDB to that process. As we evaluated the options, TimescaleDB came out as the clear winner, and the rest is history.
Shane: As an IoT company, we’ve had sensors since the very beginning. And when we started, a lot of the engineering staff came from a web consultancy, so I don’t think we did realize from the beginning that we needed a time-series database or even quite knew what a time-series database was.
“I think moving forward, TimescaleDB, at least in my opinion, is just going to be the default time-series database”
Shane Steidley
What seems obvious to us now wasn’t obvious back in 2017, when we built an entire time-series database using stored procedures and vanilla PostgreSQL. It was pretty cool when we finally brought over TimescaleDB. We were like: “Oh, it just does all this for us! Look, there’s a bucket function, and it’s going to return the right size buckets that you need. And it handles all of the weirdness of time zones and daylight savings time.” And you can ingest all this data, whereas before, because of how we were using PostgreSQL, we would struggle with ingesting the amount of data we needed to ingest.
I think moving forward, TimescaleDB, at least in my opinion, is just going to be the default time-series database. I think you're just going to have to have a reason not to use TimescaleDB because it's so simple and fits in with PostgreSQL.
Brock: The top factors that led us to TimescaleDB specifically were its tolerance for high insert rates. It's just blown away all of our expectations, even based on benchmarks that we were able to see online at the time. It's built on top of PostgreSQL, as Shane talked about earlier. There's very little in the way of a special TimescaleDB domain-specific language, and it's operationally very familiar to operating vanilla PostgreSQL.
Both of those were huge wins, just both operationally and development-wise. We always have the ability to fall back on core PostgreSQL principles or relational data models as we need to, but we also have the capability to dive deeper into TimescaleDB’s specific functionality to meet those big time-series use cases.
“I get the most pride in doing plain SQL against TimescaleDB, getting time-series results at scale, and not having to do a bunch of backflips”
Brock Friedrich
Shane: We use TimescaleDB like a time-series database should be used. We use it not just for the continuous aggregates of count data and other metrics that Brock's touched on, but the bucketing, the things that are so complicated if you push them to application code. When handled in TimescaleDB, it just gives you the right data the way that you want it. There are obviously some edge cases, but 99 % of the time, TimescaleDB just does what you want it to do.
Brock: What would we use if TimescaleDB didn't exist is one of those topics that I like not to think about because it gives me anxiety. There are plenty of other time-series database options, but none fit the cross-section of requirements that at least Density has in quite the manner that TimescaleDB does. So whenever somebody else asks me that question, like in passing, I just say, “Let's just pretend like that's not possible and go about our business.”
I get really proud of querying against TimescaleDB whenever we run really simple queries, like selecting the data from one of our sensors for a day from six years ago, and we run that at scale, and it runs like it would run in a much smaller scale like we only had a few months of data. And that goes back to one of the things I was appreciating earlier, which is that chunk exclusion –– that ability to operate what would be these really large query plans for vanilla PostgreSQL, and trim them down to something that’s predictable and reasonable, and operates at relatively low latencies. So all that’s to say, I get the most pride in doing plain SQL against TimescaleDB, getting time-series results at scale, and not having to do a bunch of backflips.
/* This query yields space count aggregates at 10-minute resolution for a given set of spaces over a three-day period,
   where each 10-minute bucket is represented in the output, even if that bucket contains no data.The query first
   selects data from a sparse one-minute cagg and unions that data to a set of empty records, generated with the Postgres
   generate_series function, then rolls up the unioned records into 10-minute aggregates.
   The union against the set of empty records ensures that all 10-minute intervals are represented in the final results.
   This step is necessary as the one-minute data is sparse, meaning a given 10-minute interval could contain no data, and
   the time_bucket_gapfill function does not register that a bucket needs to be injected if no records exist within
   an interval.
 */

select und.space_id,
       time_bucket('10m', und.inner_bucket)                                                        as bucket,
       min(und.occupancy_min)                                                                      as occupancy_min,
       max(und.occupancy_max)                                                                      as occupancy_max,
       first(und.first_occupancy, und.inner_bucket) filter (where und.first_occupancy is not null) as first_occupancy,
       last(und.last_occupancy, und.inner_bucket) filter (where und.last_occupancy is not null)    as last_occupancy
from (select c1m.bucket          as inner_bucket,
             c1m.space_id        as space_id,
             c1m.occupancy_min   as occupancy_min,
             c1m.occupancy_max   as occupancy_max,
             c1m.first_occupancy as first_occupancy,
             c1m.last_occupancy  as last_occupancy
      from cav_space_counts_1m c1m
      where c1m.bucket between '2022-05-22 13:00:00+0000' and '2022-05-25 13:00:00+0000'
        and c1m.space_id in (997969122178368367, 997969123637986180)
      union
      select time_bucket_gapfill('10m', generate_series,
                                 '2022-05-22 13:00:00+0000',
                                 '2022-05-25 13:00:00+0000') as inner_bucket,
             space_id,
             null                                            as occupancy_min,
             null                                            as occupancy_max,
             null                                            as first_occupancy,
             null                                            as last_occupancy
      from generate_series('2022-05-22 13:00:00+0000'::timestamptz,
                           '2022-05-25 13:00:00+0000'::timestamptz,
                           '10m')
               join unnest(array [997969122178368367, 997969123637986180]) as space_id on true) as und
group by und.space_id, bucket
order by bucket;
Current Deployment and Future Plans
Brock: For data visualization, we use Tableau and Grafana.The primary languages we use that interact with TimescaleDB are Rust and Python. Bonus: big shout out to JetBrains for their database IDE, DataGrip. It is the best on the market by a wide margin.
We find TimescaleDB to be very simple to use, just flat-out, dead simple. Any TimescaleDB-specific semantics, all of the defaults always take you a long way toward meeting whatever use case you're setting out to achieve. The narrative and API documentation online is first class, in my opinion.
But maybe the most telling point is that there’s very little shock value whenever you’re discovering new feature value or features within TimescaleDB. And by shock value, I mean whenever I discover something like a continuous aggregate, for example, it operates conceptually almost identically to how vanilla PostgreSQL materialized view operates, but there’s extra pizazz on top that TimescaleDB does to meet the real-time component of the materialized view, refresh in the background, and all that.
So I don't really want to undersell whatTimescaleDB is doing under the covers to make the magic happen. But, from an end perspective, coming from a PostgreSQL background, many of the features align conceptually with what I would expect if I was just writing something against the vanilla PostgreSQL.
Roadmap
Shane: When we started, we threw everything at TimescaleDB, and now we’re being more responsible users of TimescaleDB. We’re at that sweet spot within TimescaleDB where it’s found product-market fit within Density.
Brock: It’s hard to name my favorite TimescaleDB feature, but continuous aggregates have been a game-changer in a variety of different ways. Early on, whenever we first onboarded to TimescaleDB and deployed, it made development significantly faster, and we could just offload a lot of decision logic and complexity around time zone handling and bucketing (that’s a big one) to TimescaleDB and let it handle that complexity for us.
Continuous aggregates come into play in that we were able to roll up multiple resolutions of our sensor account data, our people count data, and make that available in a much more efficient way with little-to-no effort so far as the code that we actually had to write to deliver those efficiencies.
Continuous aggregates are becoming less important for us now than they were in our previous usage, just because as Shane was talking about earlier on, we're growing to such a size, and our use cases are becoming so complex that we're wanting to move to more the ETL (extract, transform, load) type of processing out of the database. So we're not monopolizing database resources to do some of those computations and move them upstream of the database into processing pipelines and still take advantage of continuous aggregates but to a lesser degree. We're doing less of the mathematical stuff in the database, but we're still using continuous aggregates to roll up high-resolution data to lower resolutions.
Advice & Resources
Brock: If I had to recommend resources, the first would probably be the Timescale blog. It’s been historically pretty informative over the years about the internals, like what’s happening in TimescaleDB underpinning a specific feature. One that I remember specifically is explaining the various compression algorithms in play for different data types within PostgreSQL. Being able to distill that knowledge down to a blog article that I could consume and then assimilate into my mental model of what was going on under the covers of the technology I was using has been helpful repeatedly.
The advice that I would give for building a scalable database or a strategy around that is that when designing for an analytic workload specifically, don't direct any read load to the master or in standby notes. Always use a read replica for enough reasons that we probably don't have enough time to talk about here.
The primary determinant of how efficient and scalable your solutions are going to be boils down to how many rows your queries have to touch for any given type of query you submit. Touching in that context includes both the scanning of index tuples and heap access for the rows, the end of the indexed contents of the rows, so be smart with your indexes and only index what you need and design towards the end of needing as few indexes as possible, because those are how you reduce that overhead that your database has to work through to fulfill a particular request or query.
Shane: So my advice, at least for an IoT company, is to consider your real-time use cases and your historical use cases and consider them separately. What we found out is we treated everything the same. Everything went through the same pipeline, and it was just queries that were different. When you're using TimescaleDB—and really any architecture—it's extremely useful to consider those use cases separately and architect them separately. They have different requirements. If you try to shoehorn all data, in real time, into any time-series database, whether it's something awesome like TimescaleDB or something else, it's going to cause problems and it's not going to scale very well. You can do a lot more by separating historical and real-time use cases.
We’d like to thank Shane, Brock, and all the folks at Density for sharing their experience with TimescaleDB in measuring and optimizing real estate usage.
We’re always keen to feature new community projects and stories on our blog. If you have a story or project you’d like to share, reach out on Slack (@Ana Tavares), and we’ll go from there.