Database Monitoring and Query Optimization: Introducing Insights on Timescale
When you create the first version of your app, all your queries are probably fast. The data being managed is not large yet, so everything fits in memory and finishes in milliseconds. Instead of monitoring your database and your queries, you spend your time elsewhere, maybe optimizing some code paths or tweaking your infrastructure to manage any slowdowns.
But, as you keep growing, with more data, you might find yourself looking at the database as the culprit. It might not be every query or every time it runs, but now you need to do some digging around database monitoring and Postgres performance, and it’s time-consuming.
And that is where Timescale’s Insights comes in. Released today to General Availability in all regions as part of our Cloud Week.
Insights allows you to deeply observe the queries that have been running in your database over a given time period, with useful statistics on timing/latency, memory usage, and more. Once you’ve pinpointed a specific query (or queries) for further digging, you can see even more information to help you understand what’s going on, including whether your database performance has been degrading or improving (e.g., because of a newly added index).
If you have been using pg_stat_statements to optimize and monitor your queries to keep your Postgres performance in check, Insights provides a complementary and flexible form of database observability but at an unprecedented level of granularity.
Keep reading to learn how Insights works and how you can save precious time and effort optimizing your queries.
A new database and query monitoring tool: How does it work?
This year, we built a scalable query collection system to collect sanitized statistics on every query running in our cloud service. We store all this data in Timescale (our fully managed cloud solution that makes PostgreSQL faster and fiercer), which can then be used to power the graphs and stats you see in Insights.
In a future blog post, we will explore the lessons we learned while doing this, which turned into the largest dogfooding effort we’ve undertaken. The scale has been massive and is a testament to our product’s (and team’s) capability: over 1 trillion normalized queries (i.e., queries whose parameter values have been replaced by placeholders) have been collected, stored, and analyzed, with over 10 billion new queries ingested every day.
In doing so, we've utilized nearly all the features across our offering: continuous aggregates, compression, tiered storage, connection pooling, replicas, and yes, even Insights itself, while building this. But, as I said, more on that in a future blog post.
Why pg_stat_statements isn’t enough
PostgreSQL comes with some standard tools to provide some of the statistics you can find in Insights. For example, pg_stat_statements is an official extension that can be installed to help see statistics from within your database. In fact, all Timescale services come with it enabled by default.
However, there are limits to this approach:
- It doesn’t store every query you run over longer timespans (i.e., days or weeks), given the overhead associated with its approach.
- The “system” queries can pollute the view.
- It is limited to PostgreSQL-level info, so useful stats from extensions are not visible.
With our collection system, we move to storing queries and their statistics in a database designed for vast amounts of data. We are able to store query statistics for longer time periods, so you can see how your query’s performance has evolved over time. We filter out queries that are not important to your app, improving the signal-to-noise ratio. And we keep statistics about Timescale feature usage, both to (1) allow you to see how hypertables, continuous aggregates, and so on help you and (2) help us determine how well key features are working.
Getting Database Monitoring Insights
The Insights feature is available in the service view of your Timescale service. The initial view can tell you a lot, but it is also potentially just the starting point of your journey.

The first thing you’ll see is a graph that lets you explore the relationship between different system resources—CPU, memory, and disk I/O—and query latency. You can zoom in, e.g., to better understand a spike in disk I/O by seeing which queries were running.
Changing the time period via zoom or using the filters at the top will update this graph view with the relevant queries. Your database is likely doing several things at once, so we don’t clutter the graph with every query running in that time frame. If you want to change which queries you’re looking at, scrolling down to the table below lets you do that.

The table shows you more info about not just the queries in the graph but the top 50 queries (based on your chosen sort) running in the time frame. You can see which queries execute most often, affect the most rows, take the longest time, and are utilizing Timescale features like hypertables and continuous aggregates.
Sometimes, that’s enough to help you track down database issues. You’ll see that a query is running more often than it used to, touching more rows than you anticipated, or it’s time to consider making that really large table into a hypertable (which enables the automatic partitioning of your data). But if it’s not, you can go deeper on individual queries.
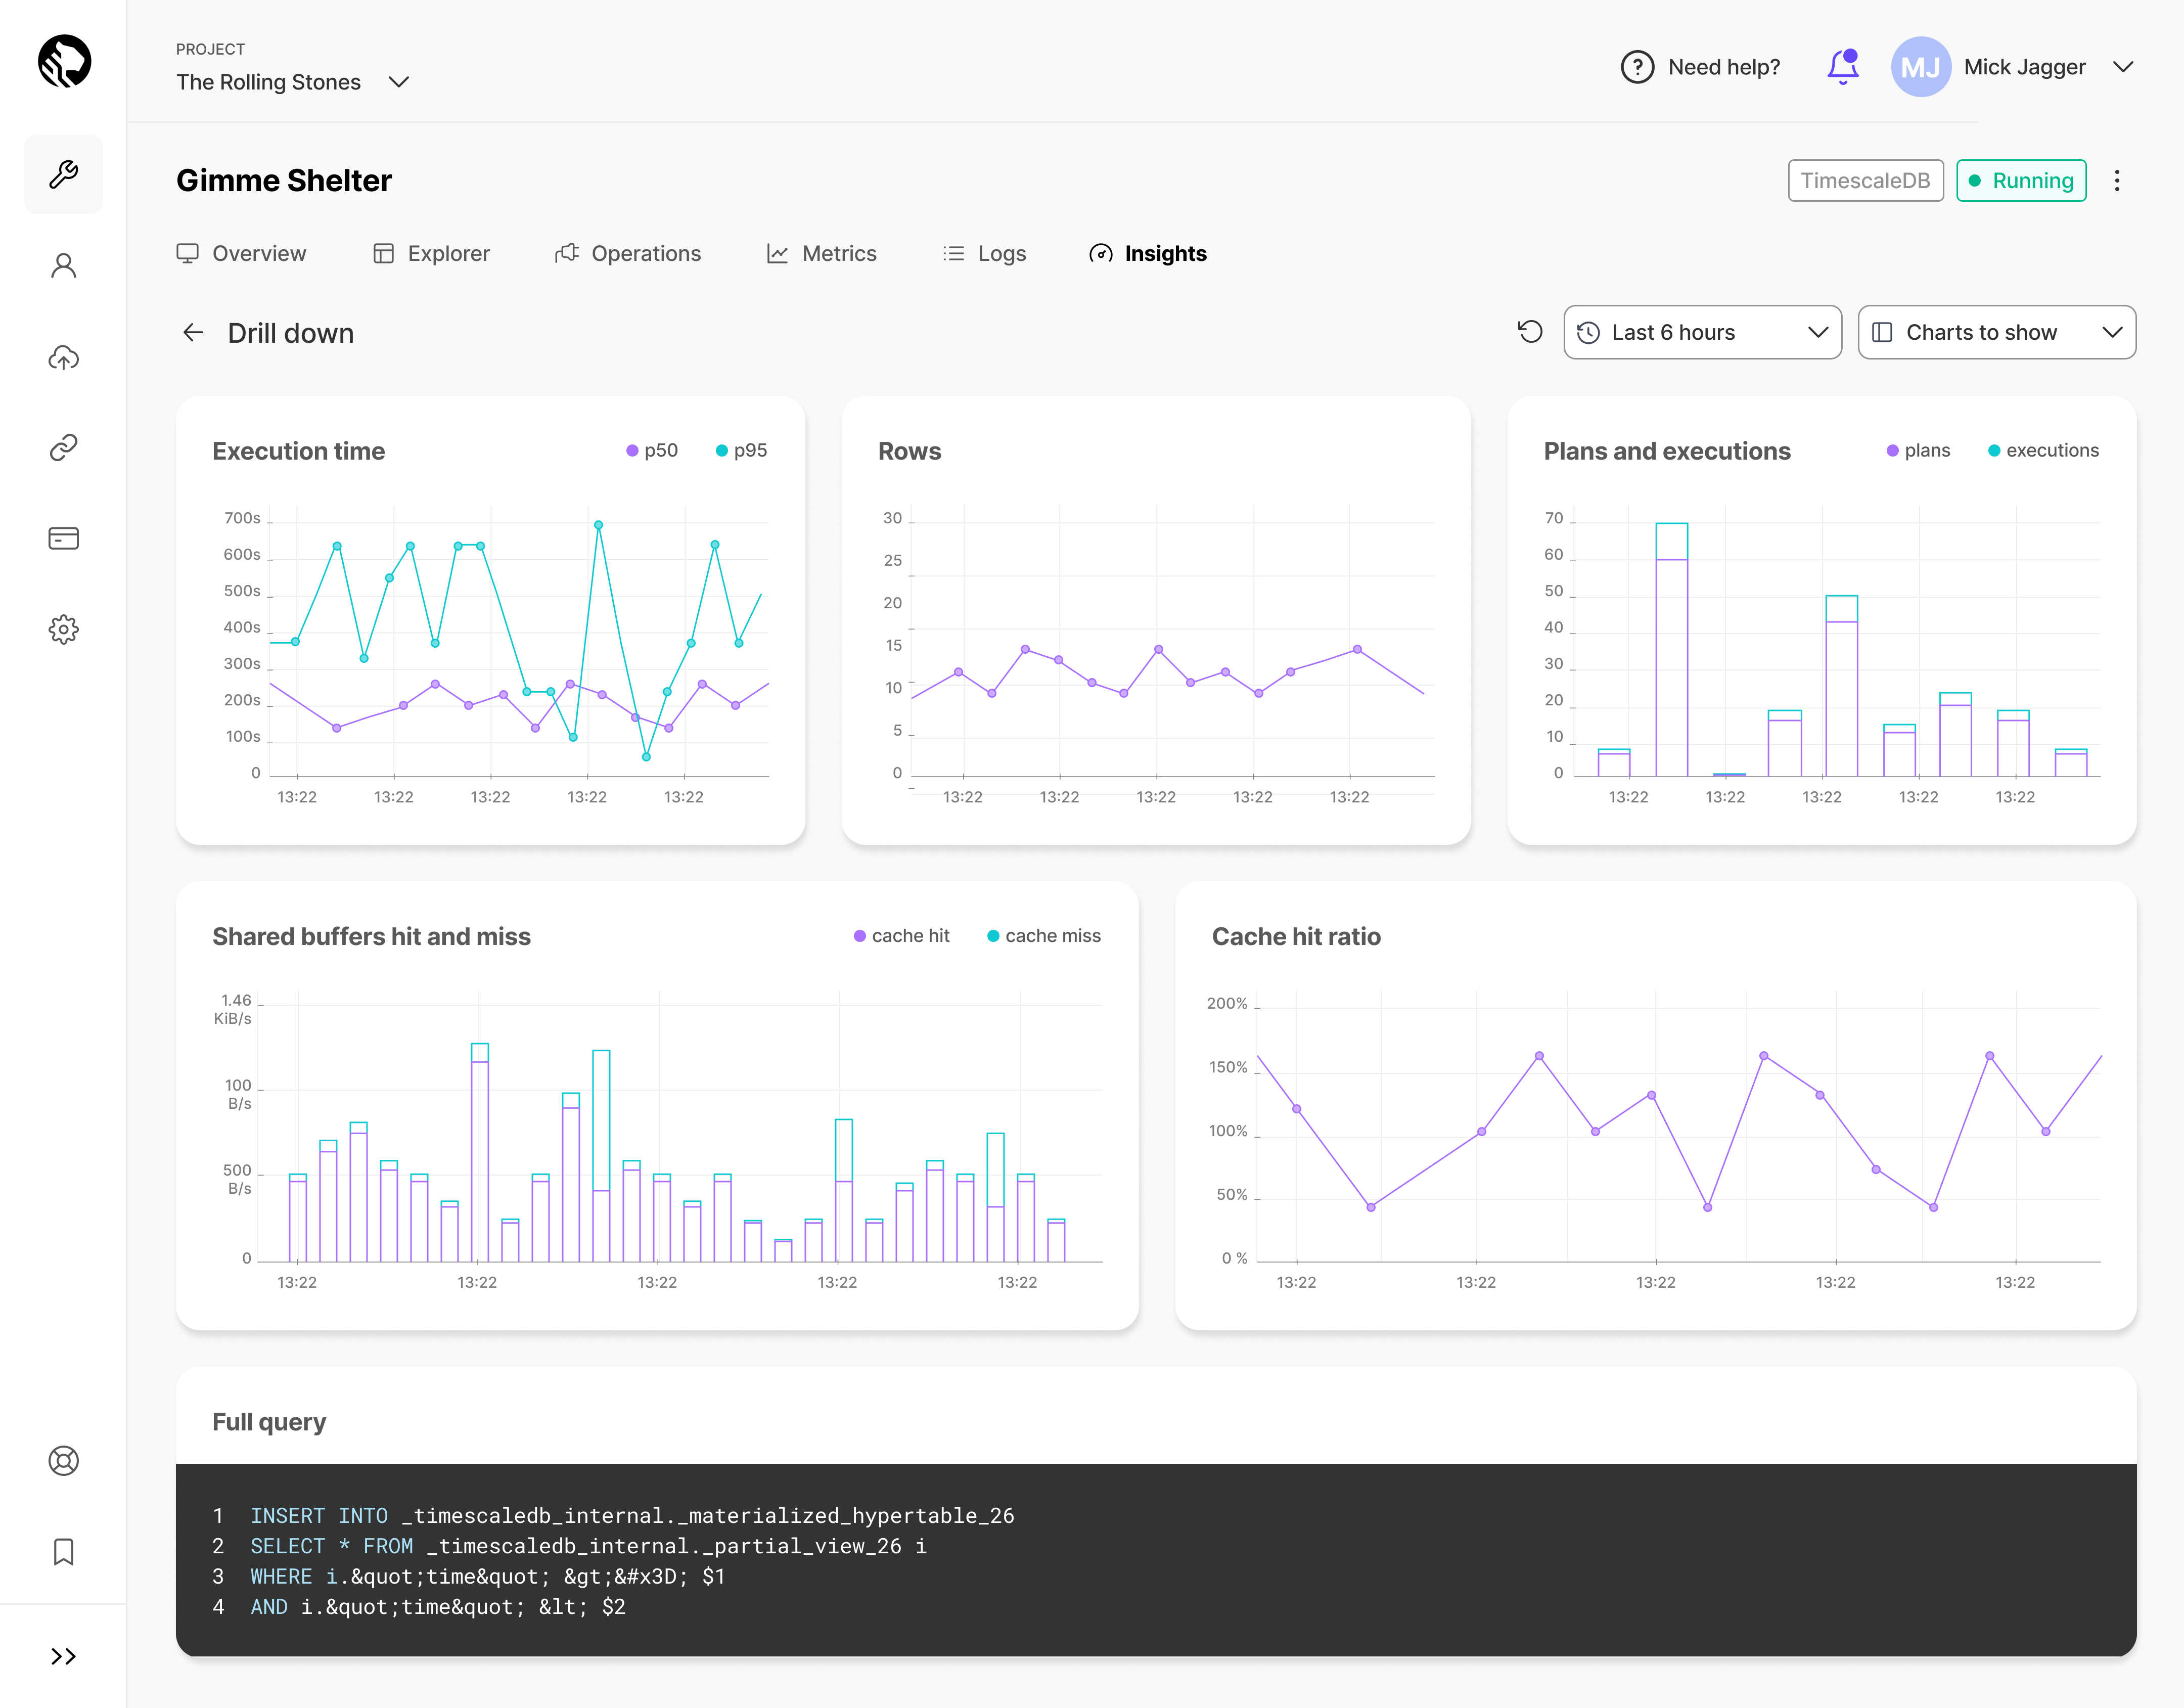
Drilling down on a query
Whether you know a particular query is problematic but aren’t sure why, or you’re still trying to determine if a query is the problem, the drill-down view of Insights provides you with finer-grain metrics to sift through.

Instead of providing aggregates over a given time period, the drill-down view will show you trends across metrics like latency, shared buffer usage, cache utilization, and so on. All the graphs are fully zoomable if you need to pinpoint a tighter time range or if you want to see how the time range you’re looking at compares to a broader picture.
This will allow you to quickly identify if you’ve experienced a few outlier or anomalous query runs, or if performance is trending in the wrong direction.
Real Use Case Example: Humblytics Story
To illustrate how you can use Insights to improve your PostgreSQL performance, we’ll share an example by our customer Humblytics.
The team at Humblytics is building a privacy-friendly analytics tool designed for Webflow. They use Timescale to track custom events, taking the burden off their users so they can directly extract information about their Webflow website interactions.
As they shared in this Twitter thread, the team was scaling quickly and realized something abnormal. After observing that their CPU load was close to 100 percent, they assumed that since they were adding new customers to their platform and their load was increasing, perhaps it was time to upscale their instance—so they added more CPU.
However, this didn’t seem to help. Their instance quickly maxed out again.

The Hymblytics team jumped into Insights (available in beta at the time under the label “Query Stats”) and immediately saw what was wrong. The issue wasn’t insufficient CPU: it was a matter of fixing a problematic query, an UPDATE query touching more records than it was supposed to. It was an easy fix, and everything went back to normal quickly after identifying the problem.
As they added: "Without Timescale, we would've been at risk of churning customers. Instead, everything was gravy 😊"
A special thank you to Humblytics for sharing their story ❤️
Getting Insights on Insights
As mentioned before, Insights is built on our most ambitious dogfooding effort to date. There will be a follow-up post to dive more into that, but one tidbit illustrates Insights’ usefulness.
The system storing all the data backing Insights is a standard Timescale service on our cloud. That is, it has no special infrastructure setup or unique features that are not currently available (or, at worst, will soon be available) to all our customers. So when we were testing out Insights and tracking down performance issues internally, we turned to Insights to help us track down which queries were slow or which suddenly performed worse.
This was a powerful tool. We discovered a few TimescaleDB performance bugs that might otherwise have persisted, and being able to visually observe performance over time as we changed key database parameters was immensely useful. We're excited to have Insights available to all our customers.
Our goal: the next time you are concerned with database performance or are debugging an underperforming query, Insights can help you reach a solution faster and easier.
To try out Insights and unlock a new, insightful understanding of your queries and performance, sign up for Timescale. It’s free for 30 days, no credit card required.