Using IoT Sensors, TimescaleDB, and Grafana to Control the Temperature of the Nuclear Fusion Experiment at the Max Planck Institute
This is an installment of our “Community Member Spotlight” series, where we invite our customers or users to share their work, shining a light on their success and inspiring others with new ways to use technology to solve problems.
In this edition, David Bailey, an intern at the Wendelstein 7-X fusion reactor experiment at the Max Planck Institute for Plasma Physics, explains how he’s using TimescaleDB and Grafana to monitor the reliability of the reactor’s heating system. Currently working on the designs of the sensor boards that measure the microwaves feeding the reactor, David needs a tight grasp on his systems and data to prevent the experiment from being aborted due to excessive heating—and is successfully achieving it with a little help from TimescaleDB.
About the User
I am David Bailey, and I am currently completing an internship at the Wendelstein 7-X fusion reactor experiment, which is operated by the Max Planck Institute for Plasma Physics in Greifswald, Germany. The experiment aims to help us understand, and someday utilize, the power of fusion for further scientific endeavors and power generation. It does this by using a novel way of containing the hot gasses needed for the experiments and tweaking its design to reach longer and longer experiment runs.

The end goal is to reach 30 minutes of uninterrupted containment of plasma heated to millions of degrees. To be able to do this, there is a lot of data to collect and process and a number of problems left to solve—one of which I can help with!
About the Project
My specific task at the internship is to help with the heating system. Because the experiment is not set up for self-sustaining fusion, where the gasses would heat themselves, we constantly have to feed in energy to keep it hot: 10 megawatts, to be precise!
We do this with various microwave sources—similar to scaled-up versions of household microwaves—and a big array of mirrors to guide the energy to the reactor vessel.

There are dangers in using these highly powerful microwaves: if dust or a fine droplet of water gets in the way of the energy, an arc can form—a lightning bolt of sorts. If the energy is not turned off fast enough, this arc can do a lot of damage, and it also means that we need to abort the experiment to wait for things to cool off again—not good if you want to run everything reliably for long periods of time!

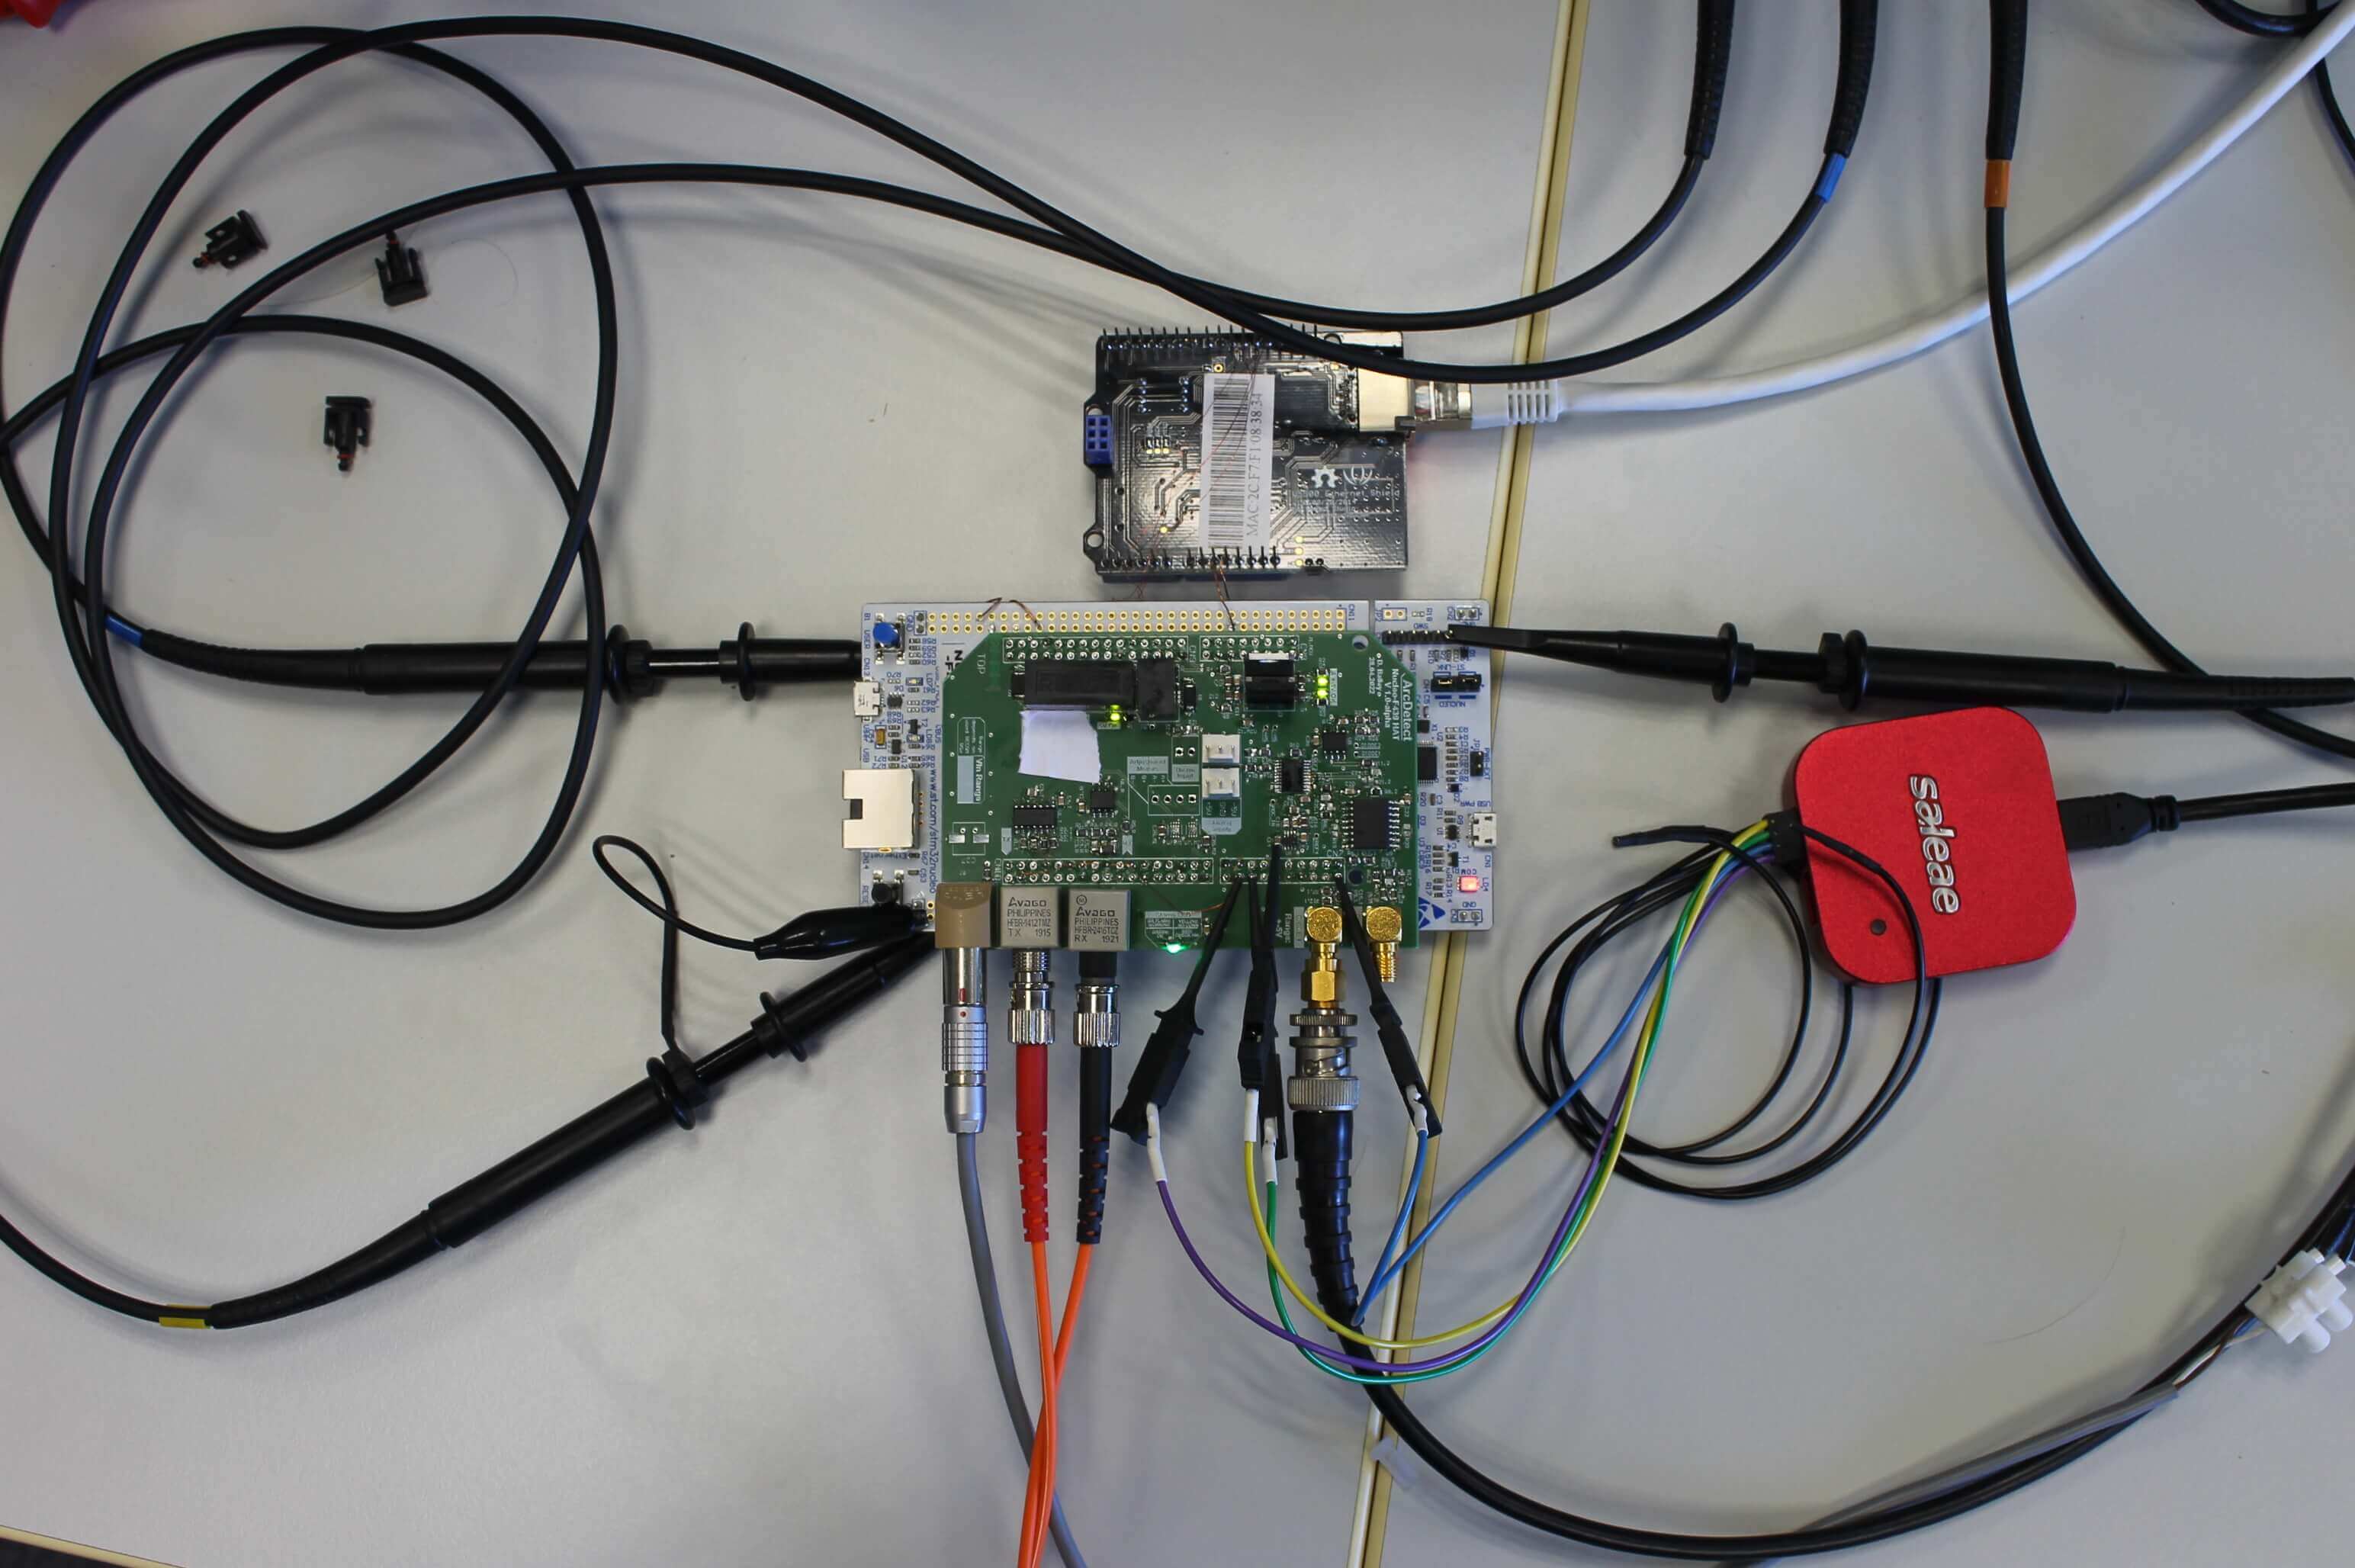
My task is to design sensor boards to precisely track the amount of energy coming out of the microwave array. The ultimate goal is to detect changes in the power output on the microsecond scale, so the power can be turned off before the arc fully forms. If done right, we can turn the heating back on without a pause and continue the experiment!
One of the key aspects of what I am designing is that it needs to be reliable. If it's not sensitive enough, or too sensitive, or if there are issues with the communication with the rest of the system, it can severely impact the rest of the experiment in a negative way.
The only way to ensure something is reliable is through data—a lot of it. A problem might present itself only after hundreds of hours or in subtle ways that are only apparent across days of data, but it can still be relevant and important to know about.
Writing a program to handle this amount of data myself would've been an unnecessary effort. It needs a tool that has the necessary functionality in it already, such as statistical operators, compression, etc., and you can get all of this in time-series databases, such as TimescaleDB!
To track that the sensors and system are working as expected, I collect and handle several types of data using TimescaleDB:
- I am recording the general health metrics of the board in question: temperature, voltage levels, etc. These shouldn't change, but the harsh environment close to the reactor might cause issues, which would be very important to know about!
- Log messages of the boards themselves to understand what the software was doing.
- And finally, detection events: every time the board sees something suspicious, it sends a measurement series of this event, about 1,000 samples taken over a millisecond. We can use this during the initial development phase to ensure everything is working correctly. I can use a function generator to send a predetermined reference signal and compare that to what the board tells me it saw. If there are discrepancies, those might point to errors in the soft- or hardware and help me fix them.
When the system is deployed, we can use these measurements to refine the detection system, to be able to set it as fast as possible without too many false positives, and gather data about how the actual physical events look to the board.
Choosing (and Using!) TimescaleDB
I started using Timescale to track data for my self-built smart home as a small playground for me—that's still running! Aside from that, I only use it for the monitoring system mentioned above, though I hope to motivate others at my research institute to use it! It is also my go-to for other projects, should I need a way to store measurements efficiently.
The top factors in my decision to use TimescaleDB were, first, the open-source nature of it. Open-source software can be much more beneficial to a wider range of people, mature faster, generally has more flexible features, and isn't so locked into a specific environment. It's also much more approachable to individuals because of no fussy licensing/digital rights management.
Then, the documentation. You can read up on a lot of things that TimescaleDB can do, complete with great examples! It doesn't feel like you're alone and have to figure it out all by yourself—there's rich, easy-to-understand documentation available, and if that doesn't have what you need, the community has been very helpful, too.
And lastly, it's still all just SQL! You don't need to learn another database-specific format, but you can start using it immediately if you've worked with any standard database before! That was helpful because I already knew the basics of SQL, giving me a great starting point. Plus, you can use PostgreSQL's rich relational database system to easily store non-time-series data alongside your measurements.
Because the Wendelstein is fairly old, database tools didn’t exist when it started. As such, they decided to write their own tool, called ArchiveDB, and never quite brought it to the modern age. It can only store time-series data in a particular format and has no relational or statistical tools aside from minimum/maximum aggregates, no continuous aggregates, and probably no compression.
Storing all my measurement data in it would have been possible, but I would have had to write all of the statistical processing myself. Using Timescale was a major time-saver! I tried other tools, but none of them quite fit what I needed. I didn't want to spend too much time on an unfamiliar tool with sparse documentation.
First, I tried the company’s standard database, ArchiveDB, but it didn’t offer much more functionality than simply saving a CSV file. I also tried another PostgreSQL extension, Citus. It didn’t lend itself nicely to my use case because the documentation was not as clear and easy, and it seemed much more tailored to a distributed setup from the start, making trying it out on my local machine a bit tricky. I believe I gave InfluxDB a try, but writing in PostgreSQL felt more natural. Additionally, it was helpful to have the regular relational database from PostgreSQL and the rich set of aggregate functions.
I might have used PostgreSQL without TimescaleDB, or perhaps InfluxDB had it not been for Timescale.

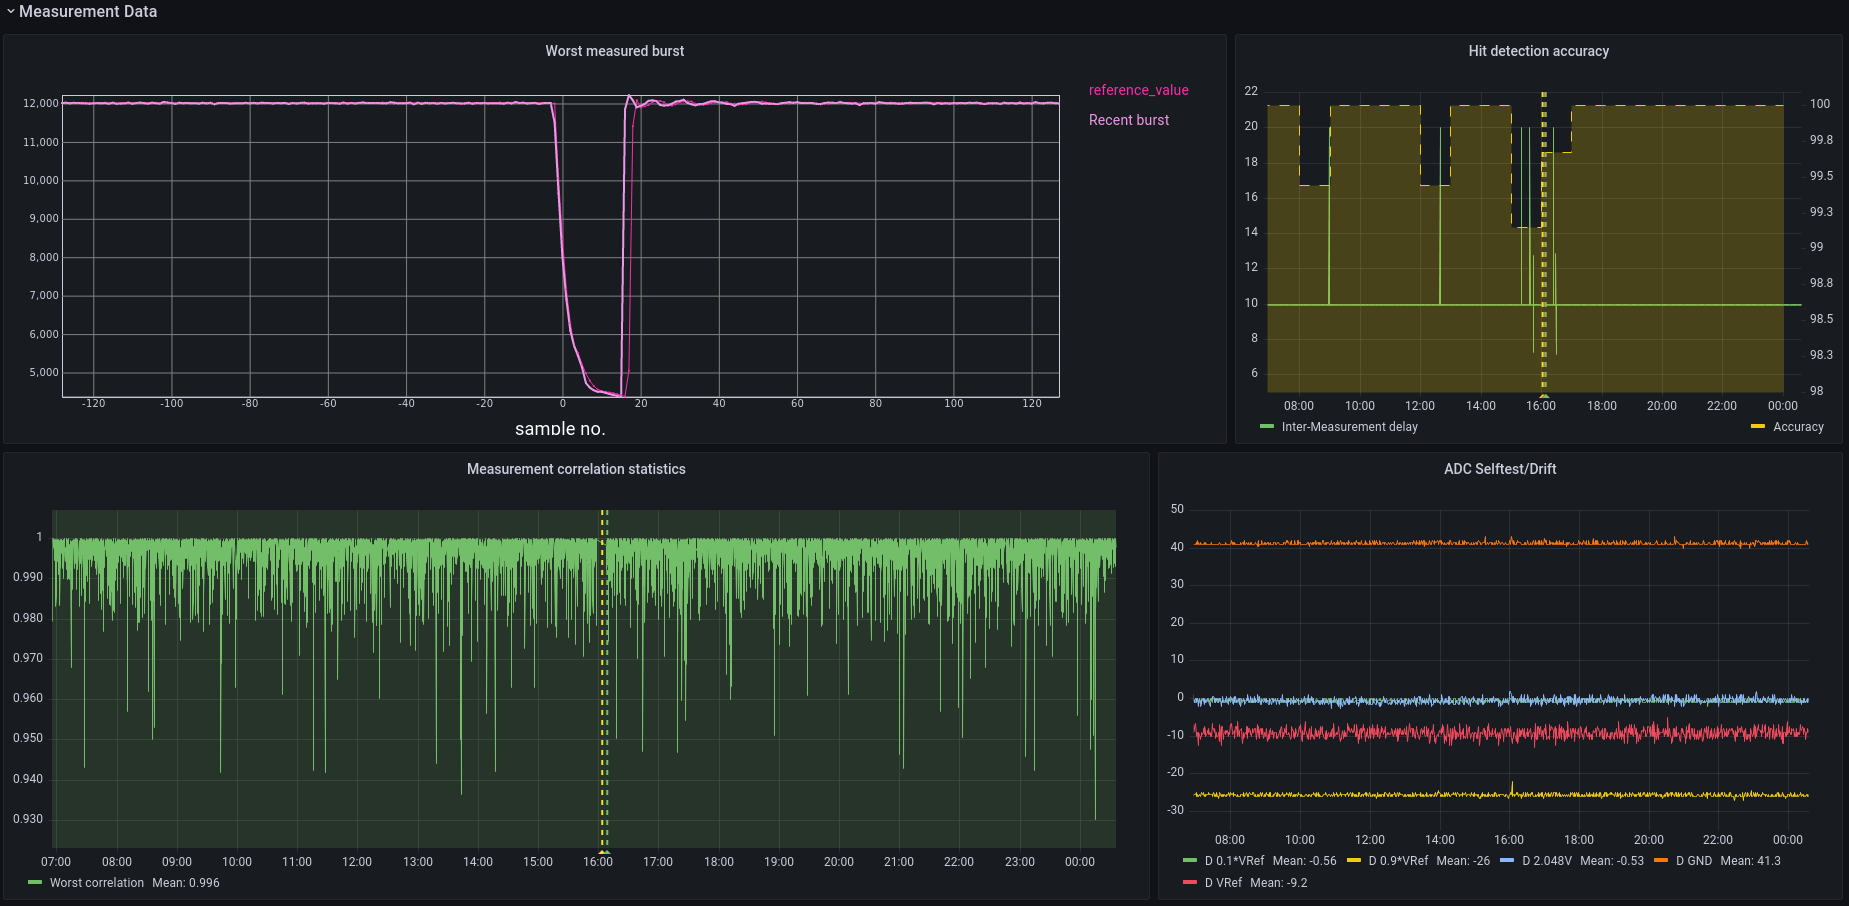
One of the things I am verifying right now is the measurements’ consistency. This means running thousands of known reference signals into the boards I am testing to see if they behave as expected. I could automate this using a query that JOINs a regular table containing the reference data with a TimescaleDB hypertable containing the measurements.
With a bit of clever indexing, I was able to use the corr(x, y) function to check if things lined up. Thanks to the rich data types of PostgreSQL, I can cache metadata such as this correlation in a JSONB field. This speeds up later analysis of the data and allows me to store all sorts of extra values for individual events.
The resulting data I then downsampled using min to find the worst offenders.
WITH missing_bursts AS (
  SELECT burst_id FROM adc_burst_meta WHERE NOT metadata ? 'correlation' AND $__timeFilter(time)),
raw_correlations AS (
    	SELECT
    	burst_id,
    	corr(value, reference_value) AS "correlation"
    	FROM adc_burst_data
    	INNER JOIN missing_bursts USING(burst_id)
    	INNER JOIN adc_burst_reference USING(burst_offset)
    	GROUP BY burst_id
)
update_statement AS (
     UPDATE adc_burst_meta
    SET metadata = jsonb_set(metadata, '{correlation}', correlation::text::jsonb) FROM raw_correlations WHERE adc_burst_meta.burst_id = raw_correlations.burst_id
)

SELECT $__timeGroup(time, $__interval) AS “time”,
   min((metadata->>’correlation’)::numeric)
FROM adc_burst_meta
WHERE $__timeFilter(time)
GROUP BY “time”
That made even small outliers very easy to spot across hundreds of thousands of samples and made analyzing and tagging data a breeze! This insight is incredibly useful when you want to ensure your system works as intended. I could easily find the worst measurements in my sample set, which allowed me to quickly see if, how, and in what way my system was having issues.
Current Deployment and Future Plans
Right now, I deploy TimescaleDB on a small, local computer. Running the Docker image has been very useful in getting a fast and easy setup, too!
For the most part, I interact with TimescaleDB through a simple Ruby script, which acts as an adapter between the hardware itself and the database. I also used Jupyter Notebooks and the Jupyter IRuby Kernel to do more in-depth data analysis.
“Grafana and Timescale really go hand in hand, and both of them are excellent open-source tools with rich documentation”
I do use Grafana extensively! Grafana and Timescale really go hand in hand, and both of them are excellent open-source tools with rich documentation. Both have Docker images and can be set up quickly and easily. It is great to plot the measurements with just a few SQL queries.
Without Grafana, I would have had to write a lot of the plots myself, and correlating different time-series events with each other would have been much harder. Either I would have had to spend more time implementing that myself, or I wouldn't have gotten this level of information from my measurements.
The main benefit of using TimescaleDB is that you get a well-balanced mixture. Being built on top of PostgreSQL and still giving you access to all regular relational database features, you can use TimescaleDB for a much larger variety of tasks.
You can also dive right in, even with minimal SQL knowledge—and if you ever do get stuck, the Timescale and PostgreSQL documentation are well-written and extensive, so you can almost always find a solution!
Lastly, there is no "too small" for TimescaleDB either. Being open source, quick to set up, and easy to use while performing well even on a spare laptop or PC, it can be a valuable tool for any sort of data acquisition—even if it feels like a "small" task!
I learned a lot about my system already by using TimescaleDB and can be much more confident in how to proceed thanks to it. In a way, it has even changed my developer experience. I have the data acquisition and TimescaleDB running continuously while working on new software features or modifying the hardware. If I were to introduce a bug that could mess up the measurements, I might see those much sooner in the data. I can then react appropriately and quickly while still developing.
I can worry less about ensuring everything works and focus more on adding new features!
Advice and Resources
Give TimescaleDB a try whenever you need to record any kind of time-series data. It's much easier to use than writing your own script or dumping it into a CSV file. The built-in functionality can take care of a lot of number crunching very efficiently, allowing you to benefit from years of finely developed functions. It's well worth the trouble, and there's no such thing as "too small" a use case for it!
TimescaleDB has helped me be more confident in developing my hardware, and I want to motivate others in my field to try it out themselves. A lot can be gained from a few days or months of data, even if at first you don't think so—some insights only pop out at larger scales, no matter what you're working on.
I am very excited to share my use case of TimescaleDB. Whenever I think of databases, I am drawn to these larger web services and big tech companies—but that doesn't have to be the case! That can also be helpful advice for others looking for the right database for their use case.
We’d like to thank David and all of the folks at the Max Planck Institute for Plasma Physics for sharing their story on how they’re monitoring the Wendelstein 7-X fusion reactor’s heating system using TimescaleDB.
We’re always keen to feature new community projects and stories on our blog. If you have a story or project you’d like to share, reach out on Slack (@Ana Tavares), and we’ll go from there.