Optimizing queries on TimescaleDB hypertables with thousands of partitions

A few months ago, we wrote about how Postgres 10 insert performance degraded when a table had many partitions (chunks in TimescaleDB parlance) and how TimescaleDB does not suffer from the same degradation.
Similar to the insert performance problem in Postgres 10, there is a problem in Postgres when executing a SELECT on tables with many partitions.
This problem presented itself in TimescaleDB during high query planning times on queries over hypertables with many chunks. In our test queries, hypertables with 4000 chunks spent 600ms just for planning this query. In traditional OLTP workloads, 4000 partitions is unrealistic. However, because of the nature of time-series workloads, this is not an uncommon scenario. Data is continually inserted over time and chunks are continually created to cover new time periods. These hypertables can get quite large: we have customers with tens of thousands of chunks!
Crucially, query planning slowdown happened even when the query itself did not have to process many chunks. For example, if the dataset included a year’s worth of data but the query specified one specific week, then the planner conceptually could exclude most of the chunks during the planning process (e.g., using constraint_exclusion). One would hope that performance should be a function of just this one week, not the entire year. Yet in fact, this planning overhead is a function of the entire dataset size, and is paid for every query on the hypertable.
Having looked at this process for inserts previously, we had a hunch that the slowdown was caused by the planner opening every single chunk belonging to a hypertable. The “open” operation also takes a lock on the table to prevent concurrent commands from changing the schema of the table in the middle of the execution of select queries. But when we actually profiled the planner, we were surprised to learn that the culprit was in a different spot.
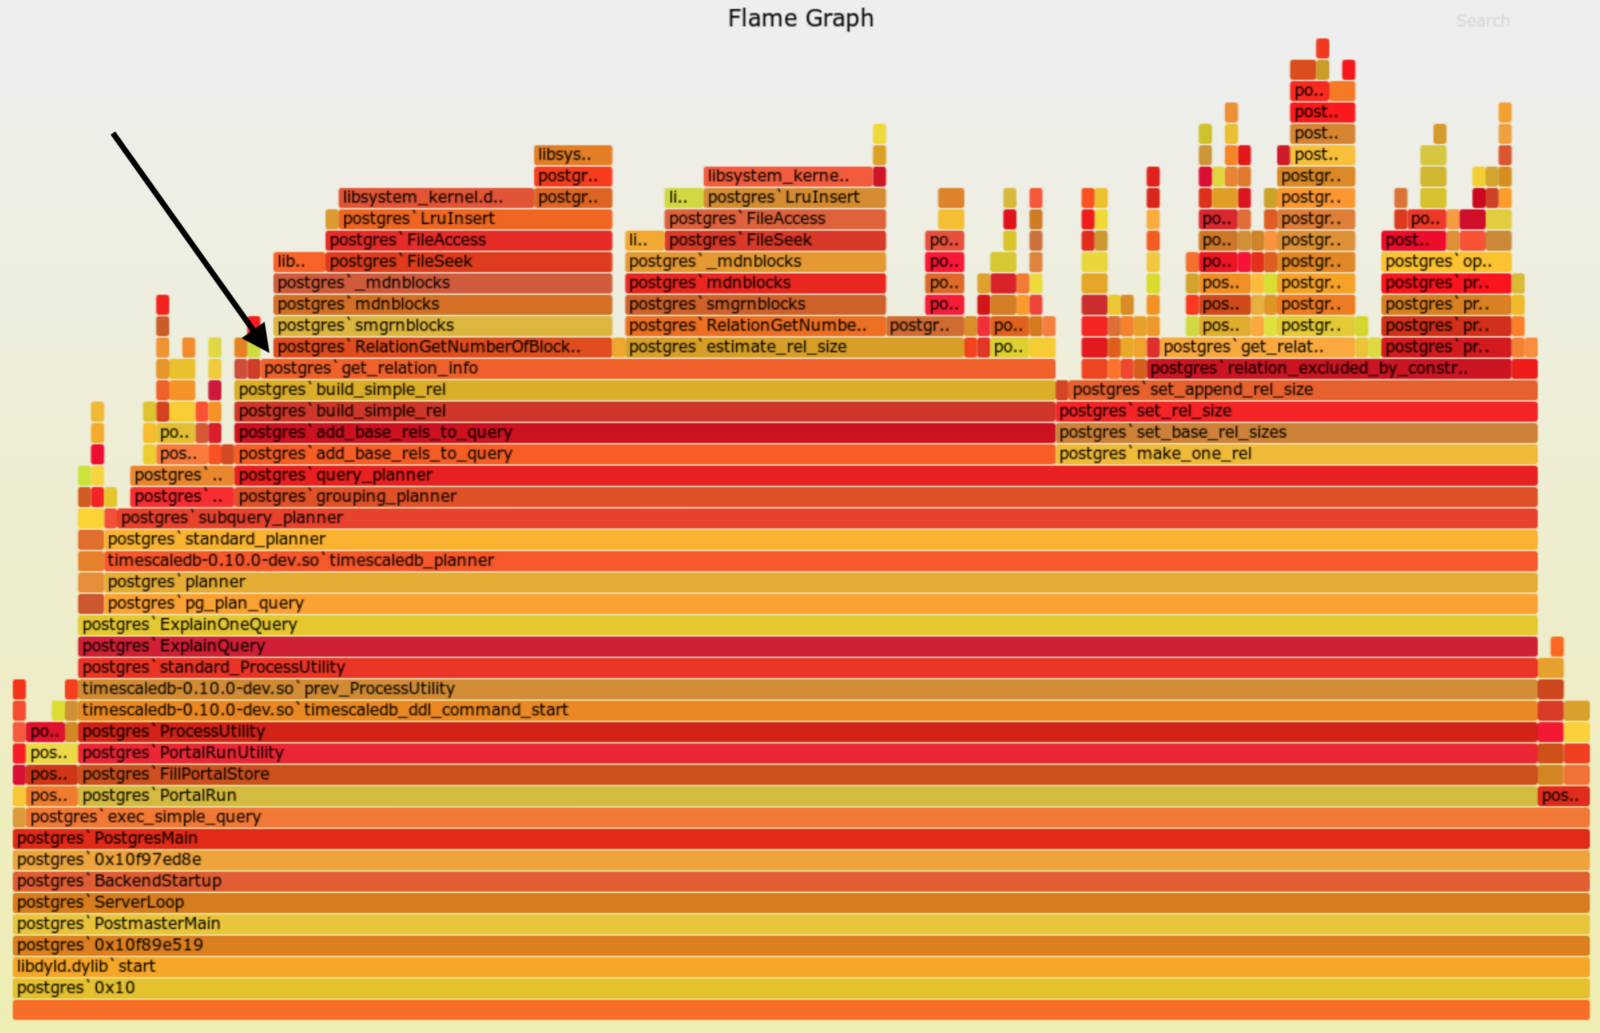
Below is a flamegraph of the profile we saw (please see the caption for how to read this type of graph):

The flamegraph shows that most of the time spent in the profile was under the get_relation_info() function. After some more digging, we realized that this function fetches the statistics for the table. Part of those statistics include fetching an approximate row count for the table. This, in turn, is achieved by opening the data file for the heap of the table and reading metadata located inside this file. And this is in fact the problem. Each query to a hypertable has to open and read metadata from the heap data files for all of these chunks. This seems redundant and is a waste of time if the chunks can be excluded from the query altogether, since chunk exclusion does not require any table statistics at all!
Our optimization of this process, as seen in TimescaleDB PR #502, moves the chunk exclusion to before chunks are opened and statistics fetched. Thus, it prevents all of the unnecessary work of getting statistics for chunks that will never be used.
As part of the update, we also changed the exclusion mechanism from PostgreSQL’s native constraint exclusion to our own take on range exclusion, inspired by Amit Langote’s Faster Partition Pruning PR to Postgres 11. Our change makes exclusion more efficient in finding the chunks that match and more effective in being able to exclude chunks based on more types of WHERE clauses.
From our tests, we found significant reduction in planning times resulting from these changes. For example, our test dataset with 4000+ chunks, dramatically decreased planning times from 600ms to 36ms, around a 15x improvement.
And on hypertables with only a few chunks, there was no corresponding additional cost to these changes. In fact, with 6 chunks, we saw the modest improvement of planning times from 6.6ms to 5.9ms.
These new planning optimizations seemed like a “no brainer” to include in TimescaleDB and we’re happy to announce that version 0.10.0, being released today, will include these performance improvements.
Overall, this is just one example of our mission to bring scalable time-series storage and analytics to PostgreSQL.
Like this post and interested in learning more?
Check out our GitHub and join our Slack community. We’re also hiring!


