How Ndustrial Is Providing Fast Real-Time Queries and Safely Storing Client Data With 97 % Compression
Ndustrial is based out of Raleigh, North Carolina, in the United States. Our company has been around since 2011, working exclusively in the industrial sector.
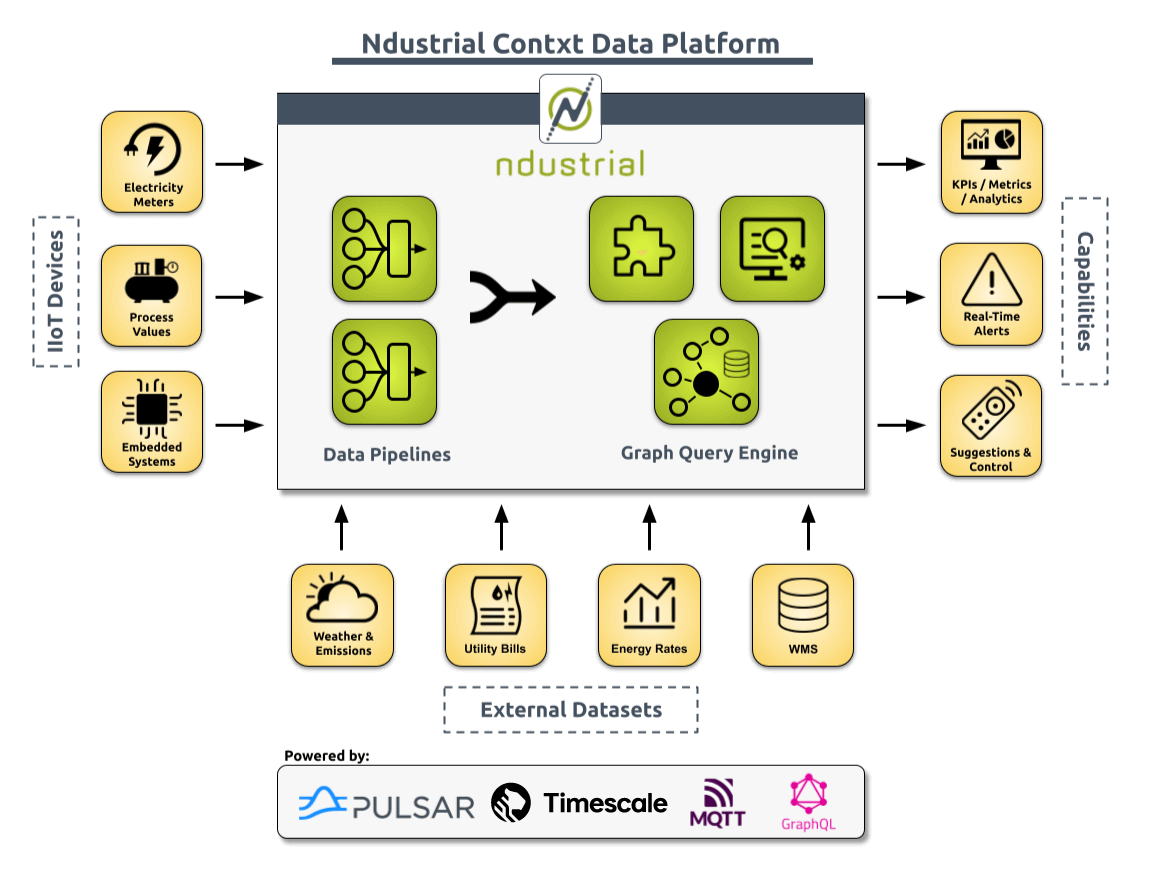
We aim to help our customers—who are large industrial energy users—save energy. And by doing so also save money and improve sustainability. A lot of that is collecting data from very disparate devices, such as industrial IoT equipment, utility meters, utility bills, and even external data, and ultimately trying to use and combine that data to give our customers a better view of what we would call production-normalized KPIs.
These KPIs are essentially metrics that we try to get down to the point of the single unit that our customers are producing, and that changes based on their manufacturing process, what sector they're in, and what their actual product is. But if we can get it down to that point, we can understand how much energy consumption is required for a single product or unit. And then help them find and even completely automate these opportunities to save energy.
We’re talking about customers that might have multiple facilities, even in the hundreds across the US and the world, so our goal in this space is to be able to aggregate all that data into a single view, understand what’s happening, and where you may have a lack of efficiencies in order to find those opportunities and save energy and money.

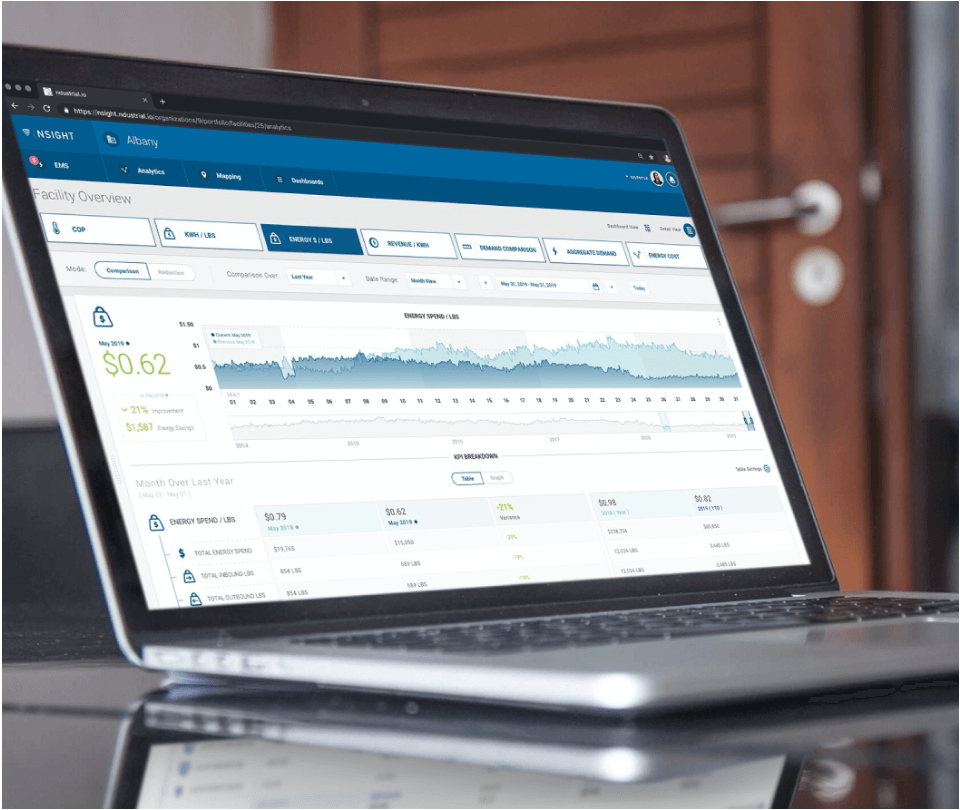
We currently have around 18 engineers working at the company, split into two main teams. We have an Integrations team that's more focused on different types of ingestion and where we get that data from (which sometimes gets very specific with our customers). The other team is focused on building our platform's more generalized extensibility aspect and a front end, our energy intensity user interface (UI), called Nsight.
I am the technical lead and software architect for the Platform team. We focus on building the functionality to turn the customers’ data into meaningful metrics based on their organization, as well as building out features for Nsight, making that easier to consume as a customer.
Implementing Real-Time Aggregations
More than 80 percent of our data is time series across the board. Now, the facets of where it comes from could be standard IoT devices just setting up their data points. It could be a time series of line items on a utility bill associated with a statement per day, per month, or per year. But it always comes down to data points associated with a timestamp that we can aggregate together to give a perspective of what’s happening.
Then, we have the other side: non-time series, to give a digital perspective of the client’s organization so you can start associating different elements by those groupings or categories to provide even more focused metrics in our UI.

I joined Ndustrial in June 2020, and we already had some applications to store and manage time-series data. This data is very unique, frequent, and needs to be retrieved quickly. But as far as leaning on databases specific to time-series data, that wasn’t really a factor in the beginning. It was more focused on, “How can we store this and at least get to it quickly?”
“Compression was a game-changer from our perspective: not having to worry about getting databases on the order of 5, 10, or 15 TB to store this information was a massive factor for us”
But then you start considering other aspects: now, I want to aggregate that data in unique ways or across arbitrary windows. That's where the drive to “We need something more powerful, something that can handle this data and not just store it efficiently but query it efficiently” comes in. And along with it came Timescale.
Compression was a game-changer from our perspective as a company: not having to worry about getting databases on the order of 5, 10, or 15 TB to store this information was a massive factor for us. But then we want the dashboarding that we have, Nsight, which is our energy intensity platform, to be very dynamic.
We don’t always know ahead of time what our customers want to visualize. We’re not trying to hard code a bunch of metrics we can report on quickly. We tried to build a much more dynamic platform, and most of our querying is actually on demand. There is some downsampling in between to make things more efficient, but the queries we are providing in our dashboard and arbitrary metrics are all things our customers are creating, and they happen on demand.
Getting data back efficiently without feeling like the UI is slow was a major win for us in using TimescaleDB. Before, we had a lot more pre-aggregation. That was the biggest power I've seen from it, along with not having to deal with having an entire team of database administrators (DBAs) to go through and make sure that's possible [Ndustrial uses Managed Service for TimescaleDB]. It’s also one of the more valuable benefits for our customers, whether or not they realize this is even happening.
Achieving 97% Compression of Postgres Data Using TimescaleDB
When I joined the company, Ndustrial had a proof-of-concept (PoC) running for TimescaleDB, so I think the company as a whole was moving in that direction. I had some experience with TimescaleDB and other time-series databases. This was only three years ago, but even then, Timescale was very prominent in the world of “Hey, we need a time-series database to be stored somewhere.”
“For one of our larger customers, we normally store about 64 GB of uncompressed data per day. With compression, we’ve seen, on average, a 97 percent reduction”
Other alternatives we researched were InfluxDB and Prometheus for storing this data. But what brought it home for us is that PostgreSQL is a foundation in our company. It is a standard of what we expect from developers and, ultimately, the main reason the PoC started to test out how we could work with time-series data without changing and bringing up new technologies and languages to learn.
We knew we would be collecting many times-series points per day—across all the different types of data we’re collecting, above a hundred million points per day. It gets massive, and we want to store and query that efficiently. It’s not just about how we store this and how we ensure we’re not spending mass quantities of money to store it, but also how we get that back out, ask questions, and query data without having to do a lot of work in between to get it into a shape where we can do that efficiently.
So, the compression aspect of TimescaleDB was something we leaned on immediately. Honestly, that was probably what sold it out of the PoC: when we tested compression with our chunks and started seeing the percentage by which we could reduce the storage size with minor degradation in query performance.
For one of our larger customers, which would take a big chunk of the time series, we normally store about 64 GB of uncompressed data per day. With compression, we’ve seen, on average, a 97 percent reduction. So down to less than 2 GB a day. And that goes from a record count of two million records to just a couple hundred thousand, which is pretty significant. It would take a larger and more performant database to hold that type of weight.
CREATE FUNCTION public.show_all_chunks_detailed_size()
    RETURNS TABLE(
        hypertable text,
        chunk text,
        time_range tstzrange,
        total_bytes bigint,
        total_size text,
        table_size text,
        index_size text,
        toast_size text,
        compression_savings numeric
     ) AS
$func$
BEGIN
    RETURN QUERY EXECUTE (
      SELECT string_agg(format('
            SELECT
                %L AS hypertable,
                s.chunk_schema || ''.'' || s.chunk_name AS chunk,
                tstzrange(c.range_start, c.range_end) AS time_range,
                s.total_bytes,
                pg_size_pretty(s.total_bytes) AS total_size,
                  pg_size_pretty(s.table_bytes) AS table_size,
                pg_size_pretty(s.index_bytes) AS index_size,
                pg_size_pretty(s.toast_bytes) AS toast_size,
                round(100 * (1 - p.after_compression_total_bytes::numeric / p.before_compression_total_bytes::numeric), 2) AS compression_savings
            FROM
                chunks_detailed_size(%L) s
                LEFT JOIN chunk_compression_stats(%L) p USING (chunk_name)
                LEFT JOIN timescaledb_information.chunks c USING (chunk_name)
            ', tbl, tbl, tbl
        ), ' UNION ALL ')
        FROM (
            SELECT hypertable_schema || '.' || hypertable_name AS tbl
            FROM timescaledb_information.hypertables
            ORDER BY 1
        ) sub
   );
END
$func$ LANGUAGE plpgsql;
The query that the Ndustrial team uses to monitor their chunk sizes across hypertables, including the compression stats they are seeing
Most companies believe this, but data is critical to us. We keep raw data: we never know how we will go back and reuse it. It's not something we can downsample, throw away, and hope one day we don't need it. So being able to store it and not having to focus too much on complex retention strategies to put things in a much slower, cold storage (versus hot storage) because we're able to compress it and still query it without worrying too much about going over limits is very significant for us.
Replacing Cassandra for time-series data
As far as query performance, I don't have an exact metric. Still, being able to make arbitrary queries, arbitrary roll-ups, on-demand unit conversion, and currency conversion at the time of querying and get responses back in the same amount of time that we got from doing pre-aggregates and without the difficulty of changing the questions’ format to roll up this data is a massive benefit.
Before TimescaleDB, we were using Cassandra, and a fair amount of mixed data could also have been in a standard PostgreSQL database. But most of our high-frequency IoT data was in Cassandra, primarily for the benefit of being able to use partitioning for fast retrieval. However, it took a lot more effort to get that data out. So as efficient as it could be to store it, we had difficulty on the other side of getting it back out in the way that we wanted it.
We also tried InfluxDB but didn’t go with it. It wasn’t just about learning a new language (InfluxQL); storing most of our relational data inside PostgreSQL was a significant factor. The platform we've been working with for the last two years has been a shift in using GraphQL as our main layer for that service, our tenancy.
TimescaleDB provides the time-series metrics, but the rest of our relational graph that builds out an organization are just entities and our PostgreSQL database. So, being able to use time-series metrics as they relate to relational entities, groupings, and various ways of querying those types of data without going outside PostgreSQL, was a significant aspect for us.
With InfluxDB, we would deal with more latency: the amount of time it would take to query on one side, query on the other side, and correlate them together. Not to mention that you’re dealing with a new language. With TimescaleDB, it’s just a SQL query.
I’ve had experience with InfluxDB, which is one of the reasons we made sure we tested that out as well. And that's probably a direction I would go back to if TimescaleDB didn’t exist. Luckily, we don’t have to. I mean, it's also a powerful database, but for the other factors I just mentioned, TimescaleDB made more sense at the time.
Continuous Aggregation and time_bucket_gapfill
From a more architectural perspective, I'm focused on ensuring the technologies we bring in aren't going to hinder our developers by having to make them learn something new every time we bring in a new engineer. If there's too much of a learning curve and it's not something they're already used to, you're going to slow down.
As a small startup, we must balance the technologies we can benefit from without having 10 developers purely stationed for managing them, which is why we chose Managed Service for TimescaleDB. You don't want to have every developer spend all their time managing it or being aware of it and worrying about what happens if you don’t apply those maintenance updates or backups correctly.
“Getting all these updates and zero downtime for deployments and replicas is significant for us because we need to assure our customers that we are as reliable as the data we're storing”
Time series is the main portion of the type of data we collect, so it’s a very significant aspect of our platform. We wouldn’t be able to do much without it. Putting that in the hands of the same developers that are also having to focus on integrations, customers, and future work would have been too much of a risk. On the other hand, getting all these updates and zero downtime for deployments and replicas is significant for us because we need to assure our customers that we are as reliable as the data we're storing.
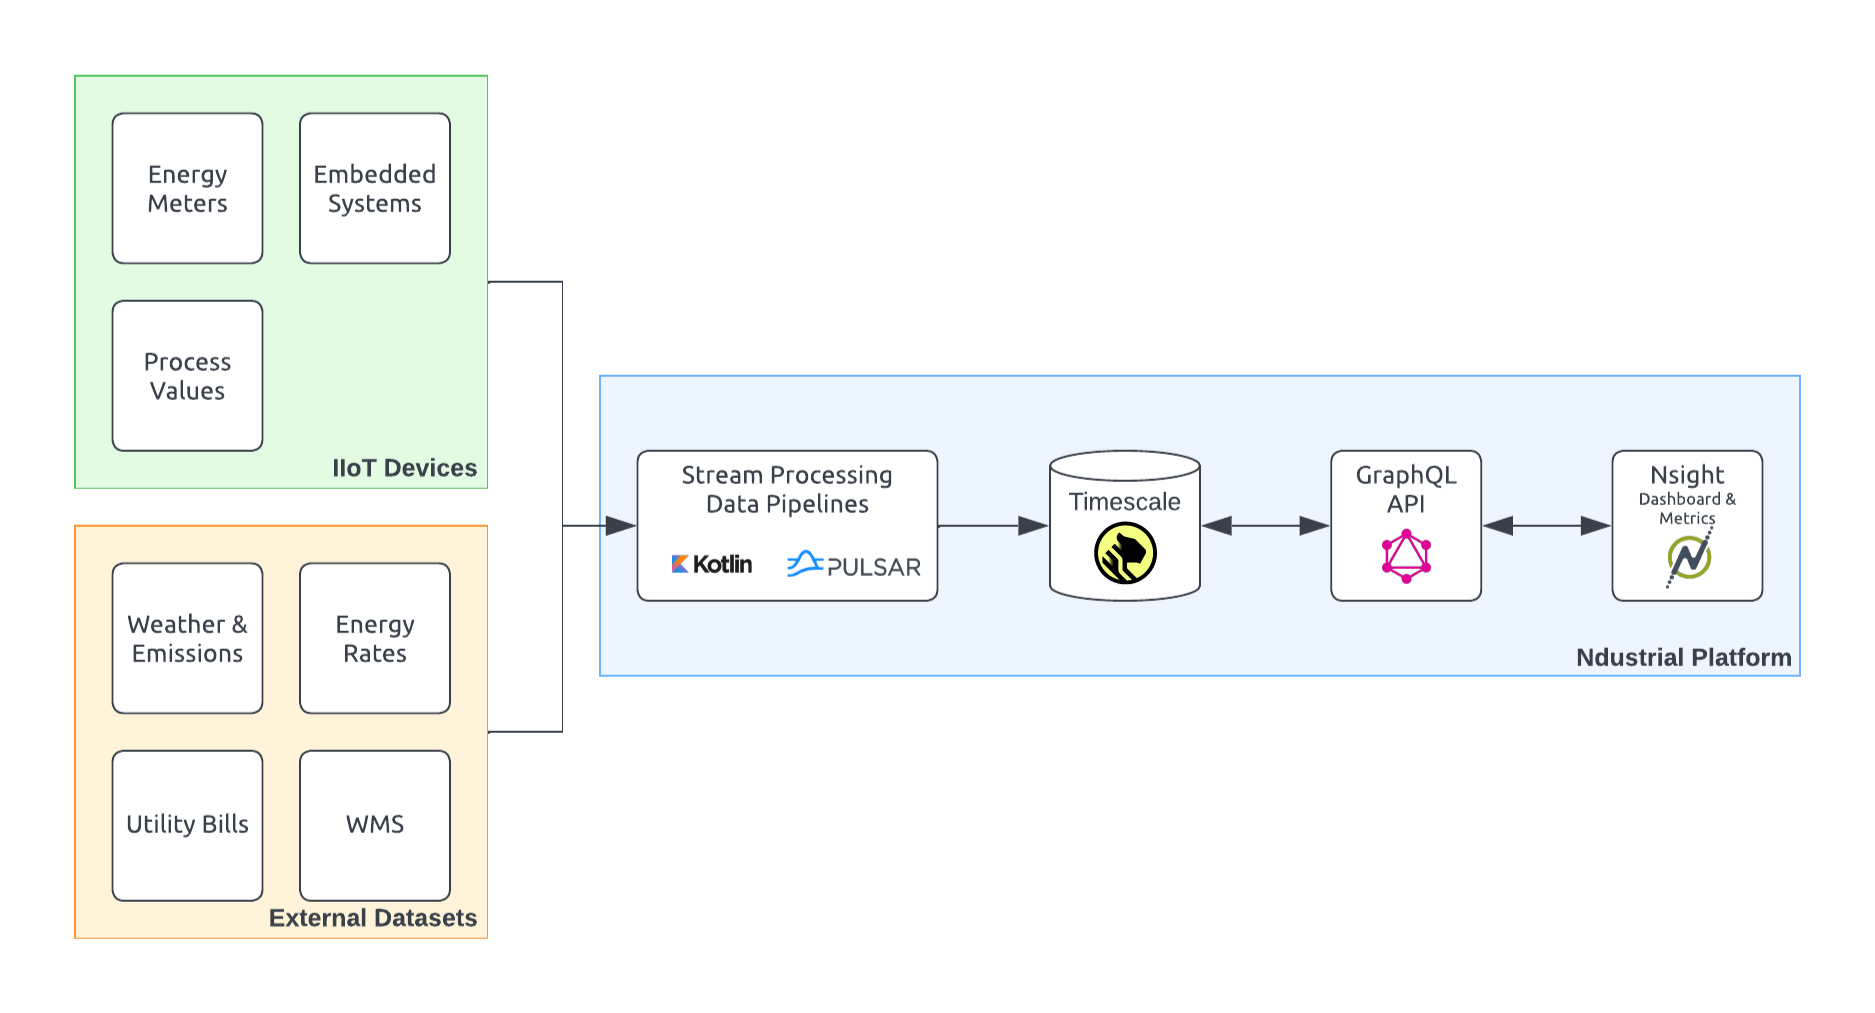
As for deployment, on the ingestion side, we use Kotlin as our foundation for building out stream-processing pipelines on a technology called Pulsar as our messaging layer. It's very similar to Kafka PTP-style (point-to-point) message queuing. Essentially, all of the ingestion that we do, whether it's IoT data or other types of integrations that we're either pulling from or getting pushed to, flows through these stream processing pipelines, ultimately landing into our TimescaleDB database. So that is our main input into TimescaleDB.
Then, on the other side of the house, we have our GraphQL platform. The platform exposes a GraphQL API that can query TimescaleDB for arbitrary queries, metrics, and results based on what the consumer is asking. And then, in our front end, which is our dashboarding, there’s a full-featured single-page app in React.
We also use other technologies, such as Grafana, for a more ad hoc view of the data, especially because we also do implementations at facilities for installing meters and devices if the customers don't already have those available. Hooking those up and having a view into our TimescaleDB database of that specific feed of data gives us a lot more visibility and speeds up the installation time without worrying about whether or not it's set up correctly.
Our data is very disparate and unpredictable in terms of how it gets sent. Some customers will have devices sending data every second to minutes or every hour. Devices might go down, come back up, and send their last days’ worth of data all at once. We could have other systems sending it at their own regular rates.
It's not normalized, so to be able to lean on TimescaleDB hyperfunctions like time_bucket_ gapfill and bucketing, and locf type of functions to turn those results into something more meaningful because we can fill the gap or understand what should happen in the case where that data point didn't exist is really powerful for us.
Obviously, compression was a big thing for us in terms of getting that in place in the beginning. And since then, we have used continuous aggregates. We are still at a point where we're building out the process of what that will look like in our platform because this data is unique—I mean, we're storing arbitrary data. We don't even know sometimes what that feed is sending us.
We’re still building a more automated process to be able to make smarter decisions about what becomes continuous aggregates, what becomes something we physically want to store, and the intervals at which we want to store it and throw away the rest. And so, I hope to lean on continuous aggregates a bit more in the future.
But, ultimately, just being able to query and use TimescaleDB features to roll up and aggregate that data is significant for us. I love following the Timescale experimental repository and seeing what people come out with each release. I basically have a list on my computer of things I intend to add to our platform soon. Just to expose those capabilities, too. Because if we can do it, why not turn that into something we can create in our app? And create it as another view, metric, or perspective in the UI. So it's always exciting to see what you guys are coming up with.
Creating an In-House Metrics Engine
Over the last few years, we've been building this new platform and leaning pretty heavily on it. There are a few pieces left that we're getting to really make it where we want it to be. Part of that is exposing many of these self-made dynamic metrics to our customers to the degree where they can just generate whatever they want that meets the needs of their system based on their use case or personas.
We have various individuals using our platform that come from different disciplines within an organization, so being able to cater metrics and analytics to them directly is really powerful, and exposing a platform in a way where they can do that without having to rely on us to do it for them is also very powerful.
To achieve this, we're building more of these ad hoc type views, which will lean on the functionality we get from an in-house metrics engine that uses TimescaleDB to query this data. Beyond that, we're entering into more of an automated controls world within our platform.
Up to this point, we've primarily been focused on getting this data visible and exposing it to our customers, showing them how they can become more efficient, and working with them more closely to help them get there. But we're moving toward the direction of taking these opportunities and automating the process that allows them to save energy and money or participate in these opportunities.
This requires us to analyze this data to predict outcomes that could happen in the near future so that we can prepare customers and get them set up and make them more valuable than others who don't have that information. It’s not really a competition, but at the same time, we want to show clients that they can get value out of their data. So having all of our time-series data in a common place that we can query in a common way is going to really make that successful in the future.
Advice & Resources
My advice is always to start with the type of data you’re storing. In the beginning, you obviously don't want to break things out too early. You never know what could shift. Wait for that next use case before you start extracting or breaking things out: you never know if you’ll end up doing it, and then you might just have more complexity on your hands for no reason.
But as a whole, data is different across the board. It's okay to store it in different places that are meant to store that data. So, having a time-series database versus storing a relational database over here and maybe search indexes over here. That's okay. I mean, is your product going to be piecing those together and really leaning on the type of data I'm storing? What is the size and frequency of this data?
And then selecting the right technologies specific to that data or maybe multiple technologies to handle that data. You should do that ahead of time because it gets more difficult the longer you wait to do so because it becomes the process of migrating all of that and doing it without downtime. But ultimately, that's just the best way to start: understand what you're storing and figure it out from there.
Regarding resources, I think that the Timescale Docs are great. Especially dealing with other technologies and being a developer, there are many times you’ll go to the documentation for some technology, and you’ll be as confused as you were before you got there. I think Timescale has done a wonderful job with their docs and how they break it out into use cases and some examples.
I also lean pretty heavily on Community Slack, whether or not I'm asking a question. It's just nice to monitor it and see what other people are asking. It might raise questions or give me ideas about issues we ran into in the past. And so having that as a resource as well, or knowing that if I have an issue, I can ask and get pretty quick and immediate feedback. It's really great.
Between the Docs and the Community, it shouldn’t be difficult to get up with what you need to meet your system’s needs.
Want more insider tips? Sign up for our newsletter for more Developer Q&As, technical articles, and tutorials to help you do more with your data. We deliver it straight to your inbox twice a month.
We’d like to thank Michael and the folks at Ndustrial for sharing their story on how they speeded up their client-facing dashboards, even for real-time queries, while carefully storing all their customers’ data by making the most of TimescaleDB’s compression powers.
We’re always keen to feature new community projects and stories on our blog. If you have a story or project you’d like to share, reach out on Slack (@Ana Tavares), and we’ll go from there.