Automated Mocking Using API Traffic: Speedscale's Story
This is an installment of our “Community Member Spotlight” series, where we invite our customers to share their work, shining a light on their success and inspiring others with new ways to use technology to solve problems.
In this edition, Ken Ahrens, co-founder and CEO of Speedscale, joins us to share how they modernize and automate testing practices for cloud infrastructure by providing API traffic data going into and out various microservices. Thanks to TimescaleDB, Speedscale´s UI loads quickly and provides the ability to drill deep down into high-fidelity data.
Speedscale is one of the first commercial technologies utilizing actual API traffic in order to generate tests and mocks. Speedscale helps Kubernetes engineering teams validate how new code will perform under production-like workload conditions.

Speedscale provides unparalleled visibility, collects and replays API traffic, introduces chaos, and measures the golden signals of latency, throughput, saturation, and errors before the code is released.

Speedscale Traffic Replay is a modern load, integration, and chaos testing framework—an alternative to legacy scripting tools that can take days or weeks to run and do not scale well for modern architectures.
If your organization provides a SaaS product that is critical for revenue, or your team is responsible for performant infrastructure, Speedscale is for you. Speedscale enables engineering leaders to generate quality automation quickly without the need for manual scripting. Since actual API calls (not scripts) are the primary ingredient, tests and mocks can be built and regenerated quickly to keep pace with the speed of changing business requirements.

As microservices become more separated logically, they are highly dependent on each other to deliver the expected functionality. This means performance problems become distributed across multiple services and can be difficult to trace. Multiple contributing factors affect the state of an application in microservices and Kubernetes environments. A testing harness that closely mirrors the production setup and incoming traffic has become a requirement for highly distributed and containerized environments.
By leveraging traffic to automatically generate sophisticated mocks, engineers and testers are granted the ability to isolate and contract/performance test smaller components in the context of a tightly coupled architecture. This superpower enables rapid testing iterations. Moreover, without the need for scripting, testing can finally move as fast as development.
About the founders
Speedscale’s leadership team comes from companies like New Relic, Observe Inc, Wily Introscope (bought by CA Technologies), and iTKO (bought by CA Technologies).
My name is Ken Ahrens. I am the co-founder and CEO of Speedcale. Much of my career has been focused on helping companies develop and manage complex web applications. I previously ran North American teams for New Relic and CA/Broadcom. Previous startups included Pentaho (acquired by Hitachi), ITKO (acquired by CA/Broadcom), and ILC (acquired by General Dynamics). My first foray into programming started with a brand new language called Java at Georgia Tech and has grown into a lifetime interest.
Matthew LeRay, co-founder and CTO at Speedscale, has invested the past 20 years in improving the performance of applications across multiple generations of technology. Previously, he was head of product at Observe, SVP at CA Technologies (acquired by Broadcom), and engineering leader at ILC (acquired by General Dynamics). He is an alumnus of Georgia Tech in both Computer Engineering and Business. His first love is debugging Golang code but he occasionally takes a break to craft hand-carved guitars.
Nate Lee, co-founder and VP of Sales & Marketing, has served a variety of roles within the software industry. Most recently, he was in enterprise sales for the digital transformation consultancy Contino (acquired by Cognizant). Prior to Contino, he served as Product Manager at CA Technologies, by way of iTKO where he was a Presales Engineer for 6 years. Before iTKO, he spent time as a support leader at IBM Internet Security Systems, and engineer at ILC (acquired by General Dynamics). He graduated from Georgia Tech with an MBA in Technology, and a BS in Computer Science. You’ll most likely find him outdoors on 2 wheels when he’s not innovating with his Speedscale buddies.
As a small, nimble startup, our normal workweek is comprised mostly of helping customers scope their use cases and deciding where to start with our testing framework (recording traffic, generating traffic replay “scenarios” comprised of tests and mocks of auto-identified dependencies). We are an engineering startup with a heavy emphasis on Kubernetes and Golang. We are also improving the protocol and version support of both our Enterprise Kubernetes version and Desktop version called the Speedscale CLI.
About the project
We noticed the application of outdated testing practices to modern cloud infrastructure (eg. UI testing, manual testing, API test tools with no mocking). As the number of connections in distributed, containerized applications grew, the need for quality automation increased exponentially. As a result, the popularity of canary releases and blue-green deployments has risen, but we believe this is due to a lack of robust quality automation alternatives.canary releases and blue green deployments have risen, but we believe this is due to a lack of robust quality automation alternatives.
Speedscale uses a transparent proxy to capture API transaction data from which to model robust API tests and realistic mocks of backend dependencies. Our traffic replay framework is capable of showing engineering teams complex headers, authentication tokens, message bodies, and associated metadata (with sensitive data redaction when necessary). In addition, the platform is able to automatically identify backend dependencies that are needed to operate your service, allowing new developers on old services to get up to speed quickly. This data is streamed to AWS S3 and filtered for test and mock scenario creation. These scenarios can then be replayed as part of validation test suites and integrated into CI or GitOps workflows.
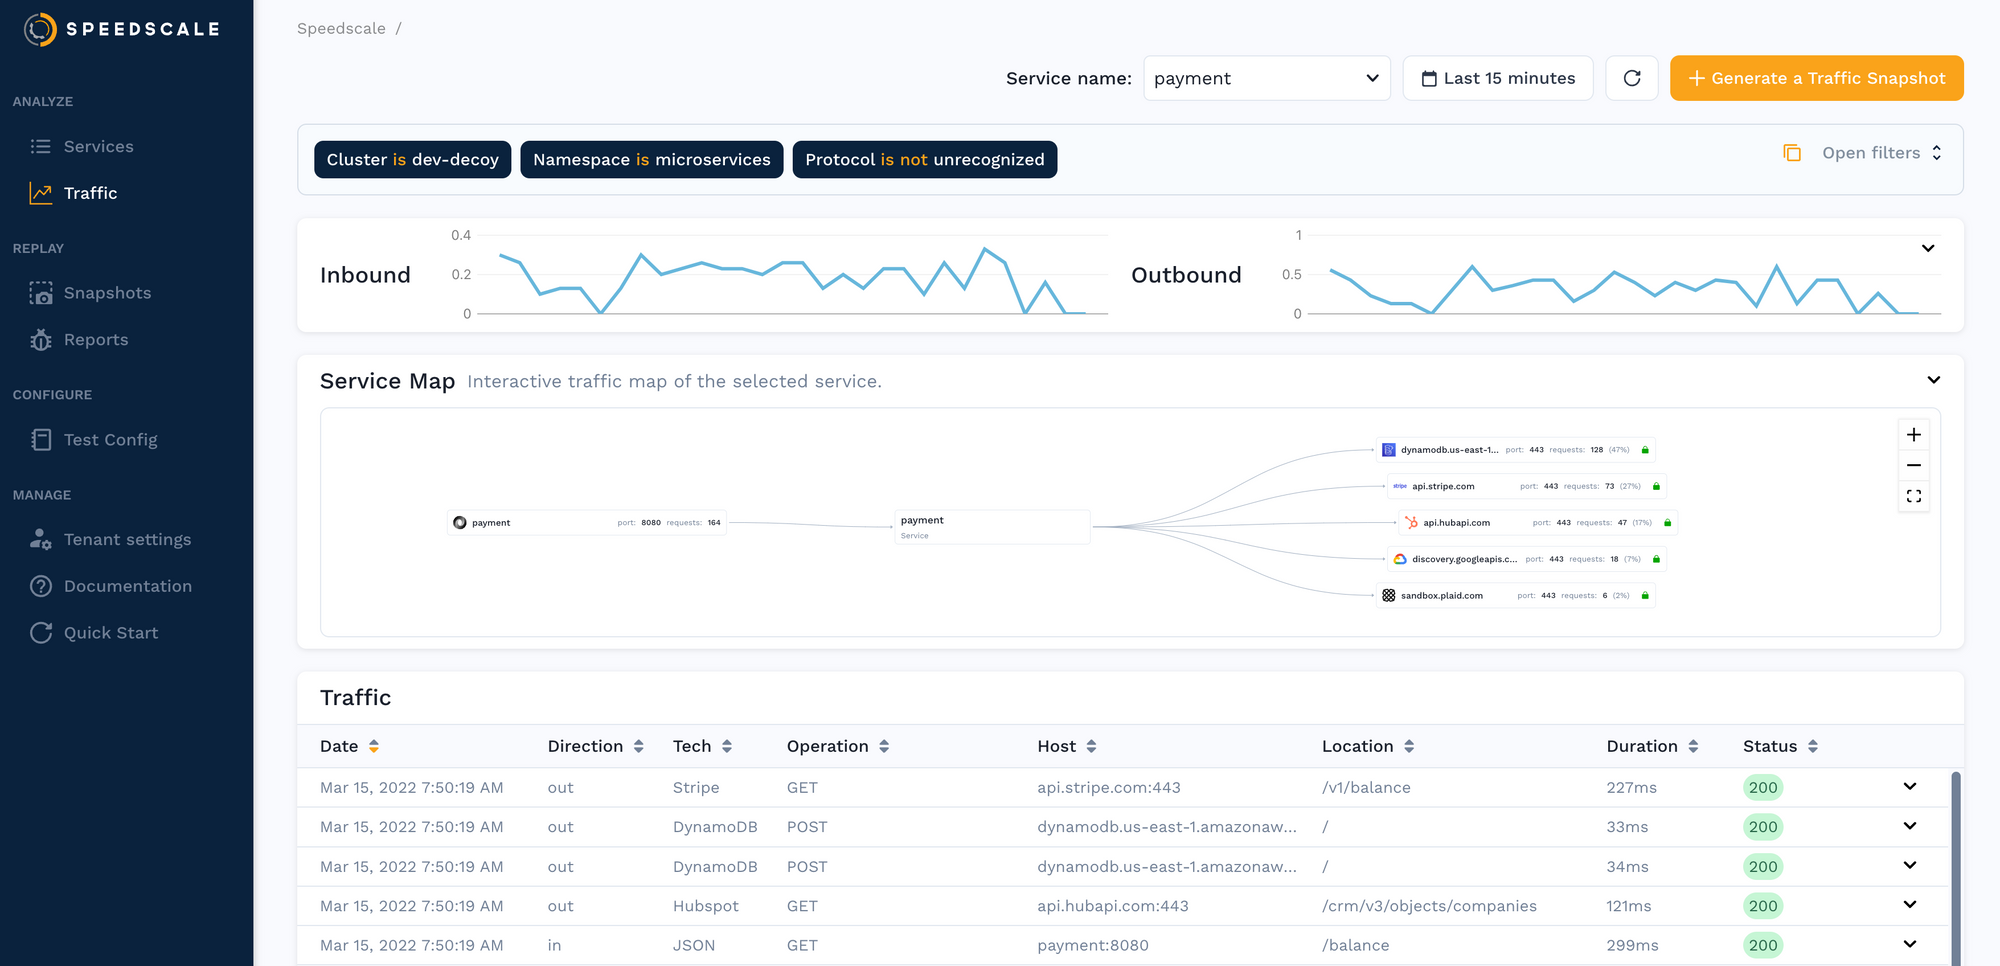
Our customers need to be able to understand the API traffic going into and out of their various microservices over time. They want to see the sequence of API calls as well as the trend of the overall volume of calls.
Data is ingested by our platform into our cloud data warehouse. As new data arrives, we determine the index where that API call can be found and write the index to TimescaleDB. Then we can use the data from TimescaleDB to find the original value. Because the indexes are much smaller than the original data, we are able to calculate aggregates on the fly and plot them in our user interface. The Traffic Viewer graph shows inbound and outbound calls, backend dependencies, and an “infinite scroll” list of traffic. All of these components are powered by TimescaleDB queries.

Choosing (and using!) TimescaleDB
We knew right from the start that we had a time-series problem. New data was always flowing in, and users wanted to focus on data from certain periods of time; they didn't want all the data presented to them. We decided to store the data in a time-series database.
We wanted a technology that could run inside Kubernetes, is easy to operate (we are a startup, after all), and scale for our needs. We initially implemented Elasticsearch and exposed the data through Kibana. It let us quickly prototype the use cases and worked great for lower volumes of data. But it scaled poorly for our use case, and we had very little control over the look and feel of the UI. Then we evaluated TimescaleDB, Influx, Prometheus, and Graphite.
We selected TimescaleDB because we were already using PostgreSQL as part of our technology stack, and also the paper evaluation looked like TimescaleDB would scale well at our load ranges.
✨ Editor’s Note: For more comparisons and benchmarks, see how TimescaleDB compares to InfluxDB, MongoDB, AWS Timestream, vanilla PostgreSQL, and other time-series database alternatives on various vectors, from performance and ecosystem to query language and beyond.
We use SQiurreL to issue SQL queries like this one that powers the inbound throughput graph.
rrPairsQuery := sq.Select(
		fmt.Sprintf("time_bucket(INTERVAL '%s', time) AS bucket", durationToSQLInterval(interval)),
		"is_inbound",
		"COUNT(id)").
		From(rrPairsTableName).
		GroupBy("is_inbound", "bucket").
		OrderBy("bucket")
We deploy TimescaleDB on the Kubernetes operator via Flux. Our core services are currently written in Golang which we use to connect TimescaleDB with microservices inside Kubernetes as well as AWS Lambda.
Currently, our architecture that touches TimescaleDB looks like this:

After implementing TimescaleDB, our AWS cloud costs went down about 35% because it is cheaper to run than the AWS OpenSearch we used before. In addition, the query performance improved dramatically, a majority of queries take under 100ms to complete.
Advice & resources
Having a Kubernetes operator was a big help for us because it was proof that this was built for our architecture.
We’ve made a version of our traffic capture capability available as a free CLI which you can find here: https://github.com/speedscale/speedscale-cli
We’d like to thank Ken and all folks from Speedscale for sharing their story. We applaud your efforts to modernize and automate testing practices for modern cloud infrastructure. 🙌
We’re always keen to feature new community projects and stories on our blog. If you have a story or project you’d like to share, reach out on Slack (@Lucie Šimečková), and we’ll go from there.