Navigating Growing PostgreSQL Tables With Partitioning (and More)

Authors: Carlo Mencarelli and Carlota Soto
So, you've been working with PostgreSQL for a while now—and things are starting to scale. Perhaps your users' table has grown up to millions of rows, or perhaps you introduced new features that demand joins between multiple large tables.
The fact is that you’ve noticed your queries are starting to run a little slower or maybe timing out altogether. You might also be noticing some maintenance overhead: operations that were routine before are starting to get tricky or take a long time to complete. And the concerning piece is that you don’t see the end for these issues, as your PostgreSQL tables are gonna keep growing and growing.
It’s time to resort to PostgreSQL partition strategies and more. This article shares tips to help you navigate your growing PostgreSQL tables.
Consider PostgreSQL Partitioning
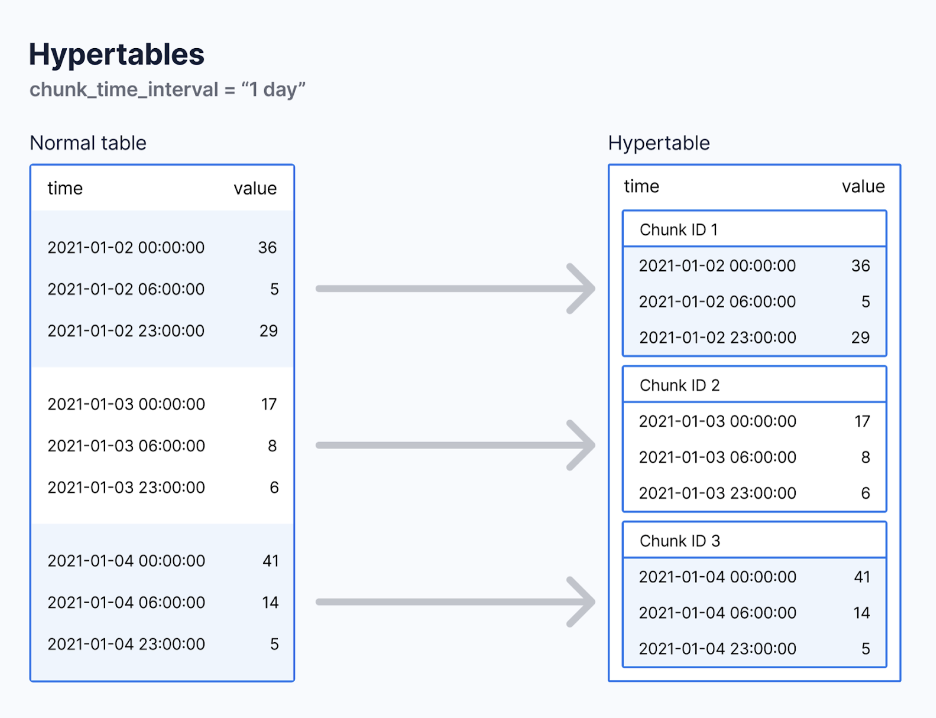
At Timescale, we’re experts on PostgreSQL partitioning, so we have to start here. Table partitioning is a database design technique where a large table is divided into smaller, manageable pieces, each called a partition (or, in Timescale terminology, a chunk). Each partition can have its own indexes, acting as a subtable containing a specific subset of data and ensuring that each row is uniquely housed in one PostgreSQL partition.
This technique can be one of your most powerful allies in managing large PostgreSQL tables. It can help you enhance query performance and streamline data maintenance operations, resulting in a more agile and responsive PostgreSQL database, even on a large scale.
However, partitioning is not a universal remedy. You should truly assess your unique use case and requirements before opting for partitioning, ensuring that you will benefit from it. This article will help you evaluate if partitioning is the right solution for you.
If you’ve decided to go ahead and implement partitioning, you should definitely consider Timescale. Timescale offers an optimal solution for those considering partitioning large PostgreSQL tables, particularly those looking to partition by time.
Via hypertables, you can automate the entire process of creating and maintaining partitions: you’d keep interacting with hypertables just like you would with your standard PostgreSQL tables. At the same time, Timescale manages all the partitioning complexities behind the scenes. Check out this article to learn more about why to use hypertables.

Timescale’s hypertables make partitioning by time automatic. You can try Timescale for free or add the TimescaleDB extension to your PostgreSQL database.
Fine-Tune Your PostgreSQL Database Tables
The beauty of PostgreSQL lies in its general-purpose character, but like any powerhouse, it requires a touch of finesse to unlock its full potential. When your PostgreSQL database and tables start to grow, it may be time to dive into the world of PostgreSQL and start fine-tuning your database.
We recently published a series of articles on this very topic, specifically covering:
How to size your PostgreSQL database: get started by knowing how much CPU/memory you actually need and how to optimize resource usage.
Key PostgreSQL parameters to fine-tune: get acquainted with essential PostgreSQL parameters like
max_worker_processes,max_parallel_workers,work_mem,shared_buffers, ormax connections.Optimizing indexes: get instructions on how to know if your indexes are being used effectively and best practices for indexing.
Designing and optimizing your database schema: get some tips on schema design, an essential element for effectively managing large Postgres databases.
Optimize Your PostgreSQL Queries
All too often, the number one thing you need is a quick and easy way to get the data to start manipulating or displaying it to the user. For example, consider a list of users and the teams that they are on. Selecting the data from the users and teams tables in a join is pretty straightforward. But what happens when you have 100 million rows in your users table?
When your users table grows to a massive scale, the previously straightforward task of querying data becomes a significant challenge—basic PostgreSQL queries can become resource-intensive.
Much can be said about the topic of query optimization. This won’t be a set-and-forget type of operation. If you’re managing growing PostgreSQL databases, you’ll need to constantly check how your queries perform via regular monitoring (more about this later) and optimize them occasionally. That said, let’s get this party started by sharing some quick tips.
Understand How Much Data You Are Retrieving
An important and often underestimated way of having a more performant query is to simply understand what data you are trying to retrieve with it. For example, consider the following query:
SELECT * FROM users INNER JOIN teams ON users.team_id = teams.id;
There are a couple of issues here. The first is using the wildcard character (*). This could be millions of rows with dozens or hundreds of columns for production databases. Depending on your dataset, this query might take seconds or even timeout, resulting in a poor user experience.
If all you need is the team name and the user's name for each user, then only fetch those columns:
SELECT users.name, teams.name FROM users INNER JOIN teams ON users.team_id = teams.id;
In general, avoid using wildcard characters to retrieve all columns and instead, specify only the columns needed for a particular operation. This reduces the amount of data processed and transferred, alleviating the load on both the database and network.
Postgres LIMIT and OFFSET Usage
Diving a bit deeper into query optimization and reducing the size of the result set, the strategic use of LIMIT and OFFSET clauses in PostgreSQL can significantly enhance performance, but it's crucial to use them wisely.
By using LIMIT, you cap the number of records returned, effectively reducing I/O, CPU, and memory usage. However, while the Postgres LIMIT clause is generally efficient, OFFSET can occasionally be a double-edged sword, especially with large datasets. It's commonly used for pagination, skipping a specified number of rows before returning the result set. But herein lies the caveat: even though OFFSET skips the initial set of rows, PostgreSQL must still traverse them to reach the desired data.
For example, in the query below, LIMIT 100 ensures that only 100 records are returned, while OFFSET 500 tells PostgreSQL to skip the first 500 records. However, as mentioned earlier, PostgreSQL still has to scan through those 500 records, which can lead to performance issues with larger offsets.
SELECT * FROM users
ORDER BY user_id
LIMIT 100 OFFSET 500;
One strategy to optimize query performance is to minimize the use of large offsets. As the offset number increases, consider alternatives, like indexed columns and WHERE clauses.
Pick the Appropriate PostgreSQL Data Types
Choosing the adequate PostgreSQL data types is essential to optimize query performance (and storage usage), particularly with large tables containing millions or billions of records.
Every data type has unique characteristics, each optimized for specific operations and data patterns. In the context of large PostgreSQL databases, the nuanced differences between data types can amplify the speed and efficiency of data retrieval and manipulation operations.
An appropriately chosen data type ensures that the database engine can process queries with maximal efficiency, utilizing optimal algorithms and operations tailored to that specific type of data.
For example, choosing a compact, efficient Postgres data type accelerates index scanning and data filtering processes, resulting in faster query responses. This optimization is particularly noticeable when you process large volumes of data.
Data type selection also affects storage usage. When your PostgreSQL tables are large, what might seem like marginal reductions in the storage footprint per record can translate to substantial savings in storage capacity. Appropriate data type selection ensures that each piece of data is stored as compactly as possible without sacrificing the integrity or precision of the data.
Run PostgreSQL ANALYZE for Improved Query Planning
Postgres has an internal query planner that plays a critical role in the execution of queries. We can get into details without getting into details: PostgreSQL takes the SQL query and figures out the best way to execute it via a process that relies heavily on the underlying statistics about the database’s structure and data distribution.
The database's statistics may become outdated after significant modifications to the database schema or extensive data alterations. In such cases, running the PostgreSQL ANALYZE command to update statistics about the table's contents is helpful. This command scrutinizes the table's current data, corrects the statistics, and equips the query planner with up-to-date information to make informed decisions. Accurate statistics ensure the query planner can optimize queries properly, balancing resource utilization and execution speed.
ANALYZE users;
An important note to remember is that adding an index updates metadata about that index, but it doesn't necessarily update the query planner in the same comprehensive way a deliberate ANALYZE command would. This is a common misconception—an index optimizes data access paths, but it doesn’t encapsulate the granular data distribution details and variances inherent in the table’s data, which is a critical aspect in optimized query planning in PostgreSQL.
Implement PostgreSQL Materialized Views or Continuous Aggregates in Timescale
PostgreSQL materialized views can be incredibly beneficial when dealing with complex analytical queries (like aggregations and joins) and large datasets. They stored the computed query result in table form, saving the database from recalculating heavy operations each time the view is accessed, and thus making your queries faster.
In vanilla PostgreSQL, materialized views need to be refreshed to update the stored data. You can do this manually or schedule it at regular intervals. If you’re using Timescale, continuous aggregates save you the work, as they automatically refresh the materialized view at specified intervals, always giving you real-time results without manual intervention.
CREATE VIEW daily_sales_summary WITH (timescaledb.continuous) AS
SELECT time_bucket('1 day', order_time) as day, SUM(total_amount) as total_sales
FROM sales_orders
GROUP BY 1;SELECT day, total_sales
FROM daily_sales_summary
WHERE day BETWEEN '2023-01-01' AND '2023-01-31'
ORDER BY day ASC;The beauty of continuous aggregates lies in their ability to incrementally and efficiently refresh data. Instead of recalculating the entire dataset, they only process the new or modified data since the last refresh. This incremental approach ensures the refresh operation remains swift and resource-efficient even as your data grows.
If you’re running analytical queries or reporting over large datasets, consider implementing continuous aggregates or materialized views to boost performance and productivity.
💡Learn more about PostgreSQL Materialized Views and Where to Find Them.
Performance Monitoring Is Your Friend
As we mentioned in the previous section, it’s impossible to talk about optimizing queries without talking about monitoring. If you're not monitoring, you're already behind—the only way to know how your PostgreSQL queries are performing is if you can track them. That becomes more and more imperative as your PostgreSQL tables grow in size.
Your approach to monitoring may differ depending on where you’re running PostgreSQL. Let’s cover some popular tools.
AWS Monitoring in Amazon RDS
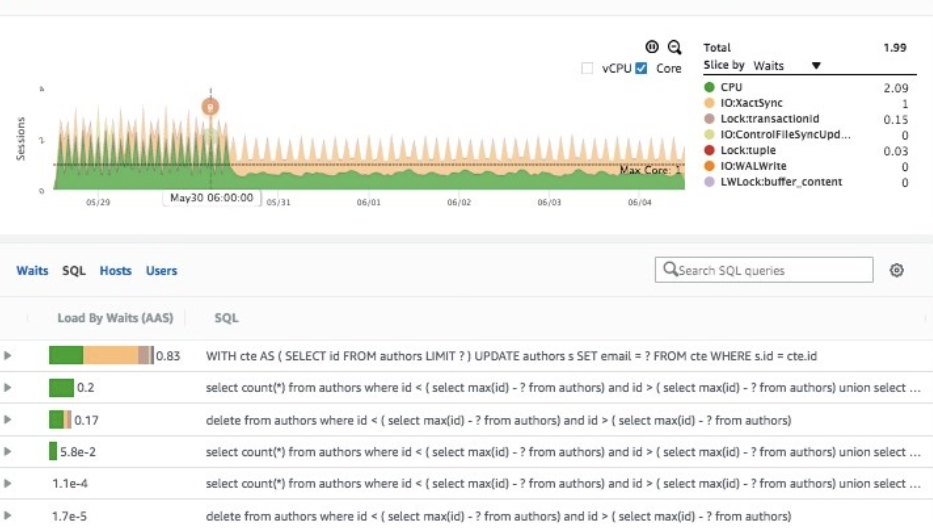
If you’re using Amazon RDS for PostgreSQL, you can use the Amazon RDS Performance Insights tool, which provides excellent visibility into what’s going on in your database. Within the "Top SQL" tab, you can identify the SQL queries with the highest wait times and receive a comprehensive breakdown categorized by specific wait types. Each classification offers a pathway to the root causes of performance issues, unveiling insights into aspects like CPU utilization, I/O operations, and more.

Query Stats in Timescale
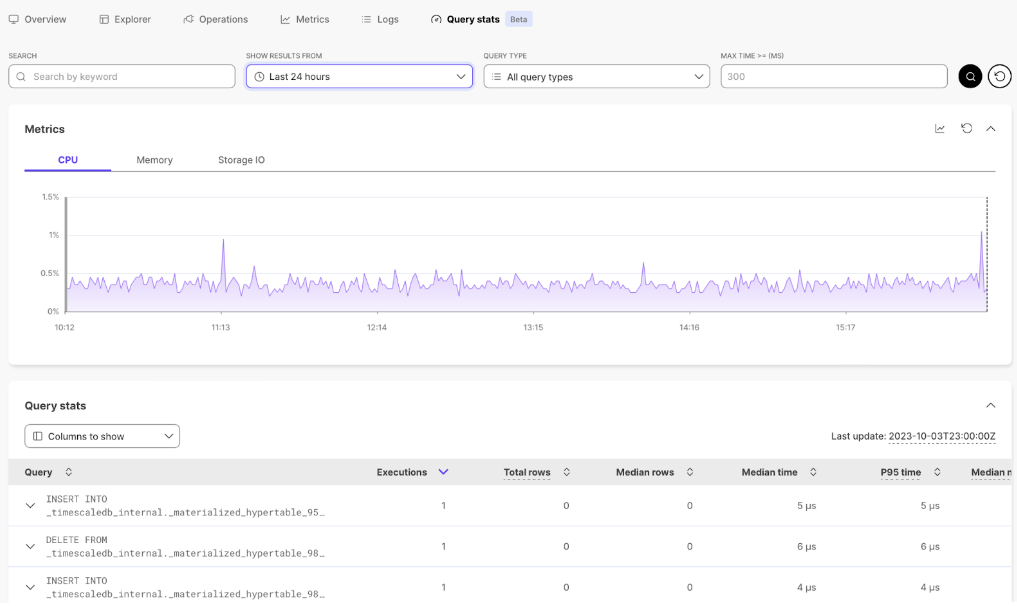
If you’re instead using Timescale, we have our own monitoring tool in the Timescale console called Query Stats. You can use Query Stats to quickly analyze your query performance, retrieving (for example) how many rows your queries are returning, the time they’re taking to run, and how they’re affecting CPU, memory, and I/O consumption.

Query Stats view in the Timescale Console
pg_stat_statements
We talk a lot about pg_stat_statements in Timescale since it’s an excellent tool for identifying slow queries and pinpointing those that incur high I/O usage and utilize indexes heavily.
Let’s go through some examples. For more guidelines on pg_stat_statements, read this blog post.
Using pg_stat_statements to identify slow queries
To identify slow queries, you can query the pg_stat_statements view, ordering the result by the total time taken by each query as shown below:
SELECT query, total_time, calls
FROM pg_stat_statements
ORDER BY total_time DESC
LIMIT 10;Using pg_stat_statements to identify queries with high I/O usage I/O can often be a bottleneck in database performance, so it’s crucial to identify and optimize queries that read or write a significant amount of data:
SELECT query, shared_blks_read + shared_blks_written AS total_io, calls
FROM pg_stat_statements
ORDER BY total_io DESC
LIMIT 10;In this example, queries are ordered by the sum of blocks read and written, giving you a list of queries performing the most I/O operations.
Using pg_stat_statements to identify inefficient index usage
This is something very nice about pg_stat_statements—it can help you differentiate which queries are leveraging indexes effectively and which are not. Below is a query example that can be used to identify the top 10 queries by the number of blocks read, which might suggest insufficient index usage:
SELECT query, shared_blks_read, calls
FROM pg_stat_statements
ORDER BY shared_blks_read DESC
LIMIT 10;P.S. pg_stat_user_indexes can also help you here, as we explain in our article on indexes.
PostgreSQL EXPLAIN
The EXPLAIN command in PostgreSQL is a powerful tool for understanding the execution plan of a query, providing insights into how the PostgreSQL optimizer processes the query. There are a few things to look for in the output that can provide quick feedback on what to do to fix slow queries.
Identifying sequential scans The main thing to look for would be to watch for any sequential scans. These are pretty resource-intensive operations on large tables, leading to longer query execution times. Identifying sequential scans can be an excellent way to identify indexing candidates (this said, make sure to review our article on indexes to consider all the caveats).
Let's take an example query and examine its execution plan using the PostgreSQL EXPLAIN command:
EXPLAIN SELECT * FROM employees WHERE salary > 50000;
If the output includes a line like this:
Seq Scan on employees (cost=0.00..18334.00 rows=4834 width=78)
It indicates a sequential scan is being performed on the employees table. To optimize this, consider creating an index on the salary column to allow PostgreSQL to quickly locate the relevant rows without scanning the entire table.
CREATE INDEX idx_employees_salary ON employees(salary);
Observing high-cost estimates
Cost estimates are another crucial aspect of the EXPLAIN output. They provide insights into the expected runtime of various parts of the query execution. A high-cost value usually signals inefficiencies in the queries. Indexes, join optimizations, use of limits, and offsets all help reduce cost estimates.
Here’s how to examine the cost in an execution plan:
EXPLAIN SELECT * FROM orders INNER JOIN customers ON orders.customer_id = customers.customer_id;
An output might appear as follows:
Nested Loop (cost=0.00..132488.25 rows=5000 width=256)
A high cost, like 132488.25 in this example, suggests there may be inefficiencies in the query. In such cases, scrutinizing the JOIN operations, creating or optimizing indexes, or reconsidering the query design could enhance performance.
Hardware Considerations for Your Large PostgreSQL Tables: Can Hardware Solve My Problems?
Lastly, let’s address the topic of hardware.
When dealing with large PostgreSQL tables and starting to experience some performance hiccups, throwing more hardware at the problem will be highly tempting. It seems like a straightforward solution: you can increase the CPU and memory and resolve performance issues. But this is (usually) not a good idea.
Relying on hardware to fix your unoptimized database is like applying a band-aid on a wound that requires stitches. As your PostgreSQL tables continue to grow, increasing your CPU and memory might offer a temporary fix, but the situation will exacerbate in the long term. The underlying performance issues will likely resurface sooner or later, this time magnified due to the increased data volume and complexity.
There are some exceptions to this rule. For example, employing read replicas can be a viable option in specific scenarios, especially where the workload is predominantly read-heavy. A read replica can alleviate the load on your primary database by handling read queries, leading to enhanced performance and responsiveness.
But, read replicas cost money: make sure to evaluate the specific nature and demands of your workload to determine if a read replica is the solution you’re looking for or if you should explore other optimization strategies.
Also, there’s no denying that sometimes, increasing memory or I/O will be the way to go. Perhaps the nature of your load has changed, or it’s now much more demanding. But, before opting for hardware expansion, exhaust all other avenues of optimization.
When running large Postgres databases, your goal should be to achieve optimal performance without unnecessarily inflating operational costs since your bill can and will rise quickly. Ensure you build a habit of analyzing your queries, evaluating your indexes, optimizing your partitioning strategy, and all the other advice we covered today.
Growing Is Good (If You Know How to Handle It)
As we wrap up this introduction on handling growing PostgreSQL tables, it's clear that adopting a proactive, strategic attitude is vital. The challenge of scale is an inherent aspect of a growing PostgreSQL database. This is good news—a testament to your application’s success!
As your data volume grows and your queries become more complex, you’ll start facing some performance and management challenges, but don’t get overwhelmed. There are plenty of PostgreSQL partition strategies and tools out there (like Timescale) to help you keep your PostgreSQL database running fast. If you’re looking for advice as you navigate this new world of PostgreSQL optimization, we’re always available for questions in our Community Slack and Forum. You’re not alone! Make sure also to review our other resources on the topic.