My table has 37 blocks, and each block has 5 million pieces of data.
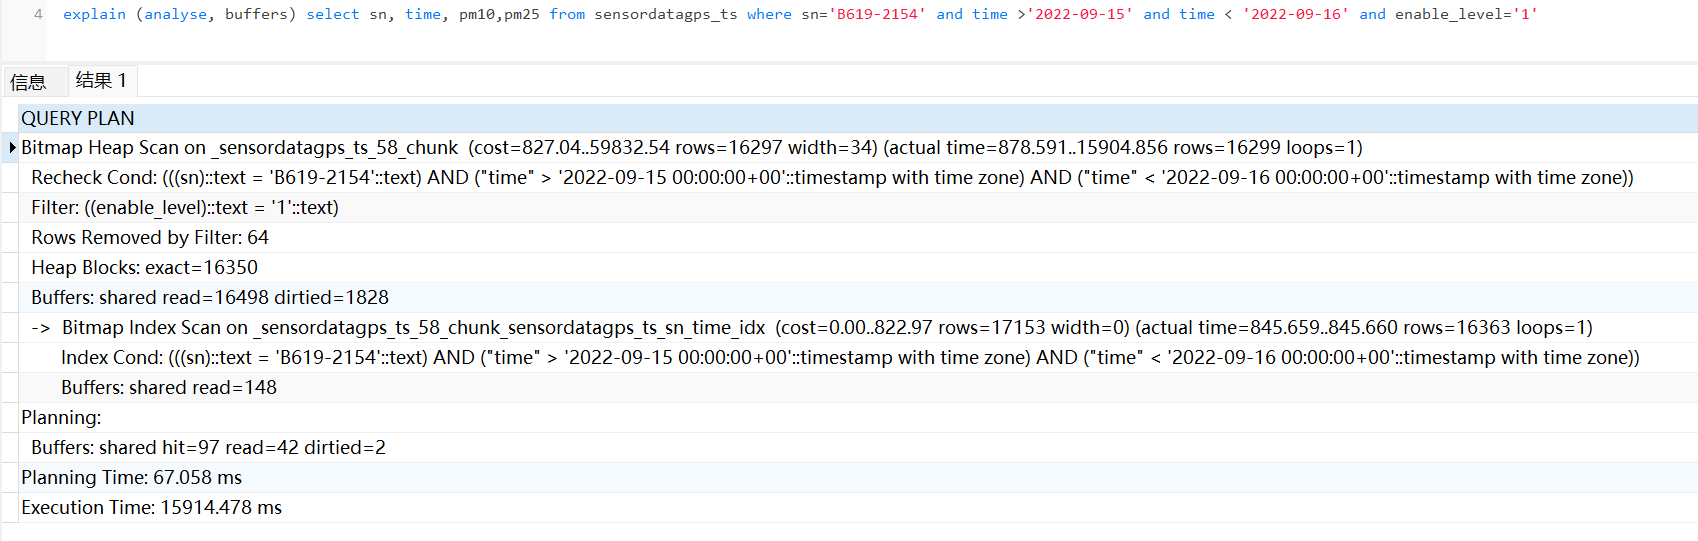
When I query uncompressed data, it takes 16 seconds.
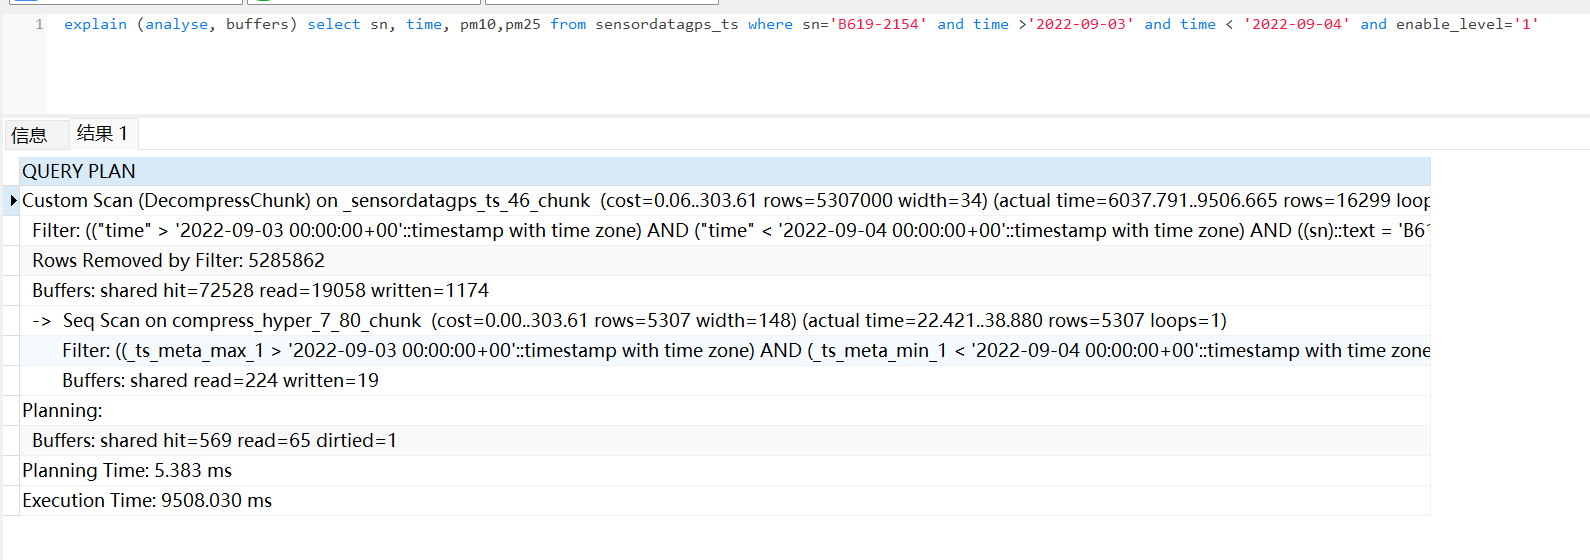
It takes 9.5 seconds to query compressed data.
A common mis-believe is that compressed data should be much slower (due to decompressing the data). That is not how Timescale compression works though.
The individual columns are compressed independently into a columnar-like fashion (internally into arrays). That means that every column can be decompressed individually. That minimizes the actual data being read from disk, yielding to much less IO traffic and operations. Hence often less work to do and a speed increase for queries.
You can see that the compressed chunk (though it uses a sequential scan) reads much much less buffers. More can be found on the docs and blog:
Thanks a lot for your answer, I see why compressing data is fast.
But I still don’t know why the query speed is so slow, it hits the compound indexes, I think the query should be completed within 500ms.
And how to see that compressed data is read much less buffers.
And how to see that compressed data is read much less buffers.
explain (analyze, buffers). In your screenshot the normal table read 16498 buffers and the compressed only 224.
But I still don’t know why the query speed is so slow, it hits the compound indexes, I think the query should be completed within 500ms.
What is your index definition and the compression settings timescaledb.compress_orderby, .compress_segmentby? The query plan says it’s using a seq scan over compressed chunks. Try adding the sn column to compress_segmentby, this way it will be able to filter by sn and will be faster.
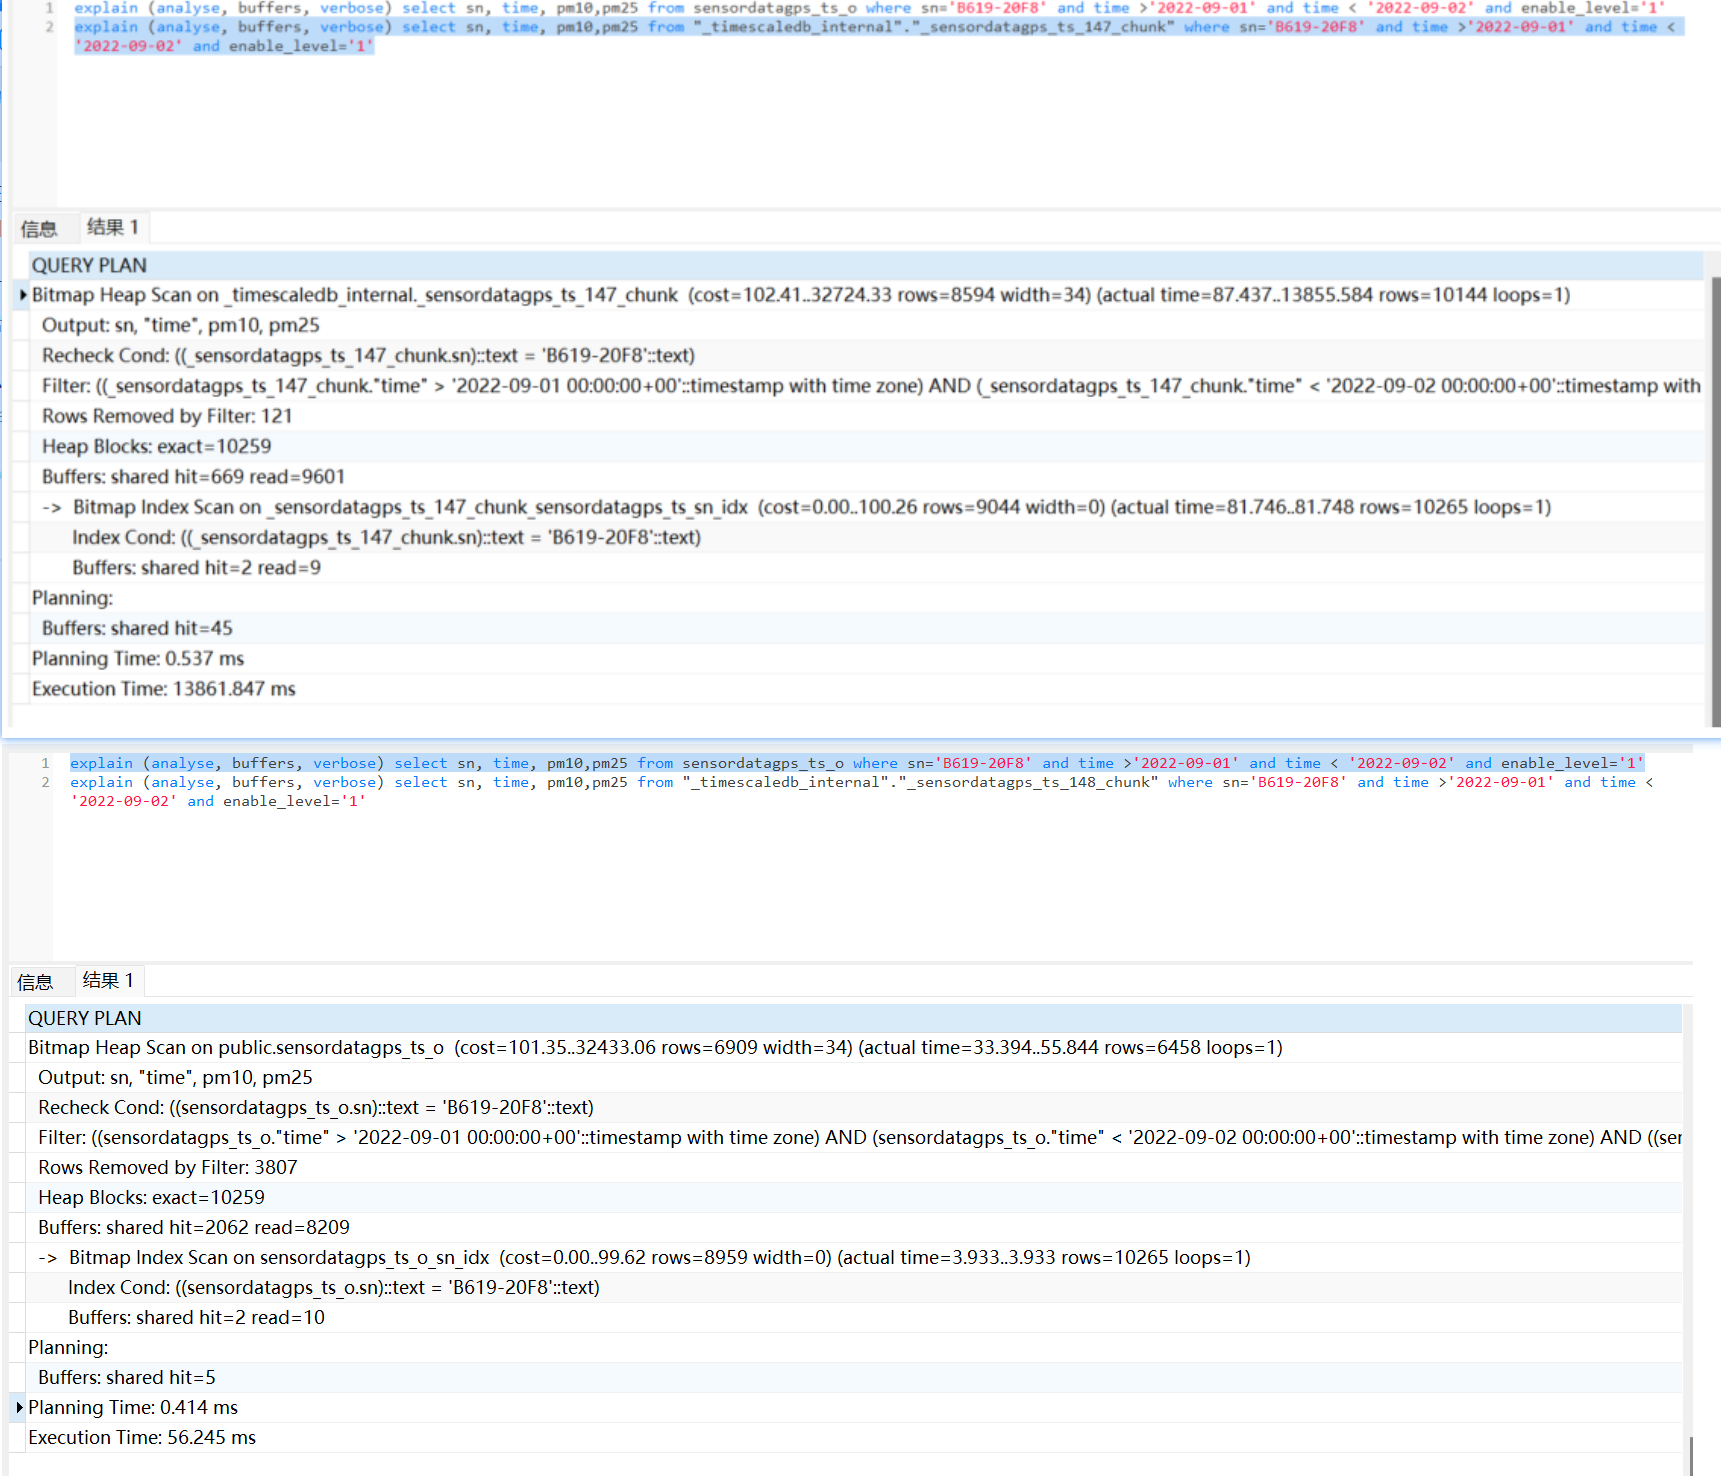
I created a normal table(sensordatagps_ts_o) with the same structure as the hypertable, stored a block of data, and used the same btree index(sn). I found that there is a huge difference between querying a block alone and a normal table. what could be the reason ?