In brief:
Hi all, I’ve been trying to set up a multi-node TimescaleDB cluster in Kubernetes and I’m having a few issues with ingestion and space partitioning.
We’re currently running a single node cluster successfully which is able to ingest around 3.5x our incoming messages. With the multi-node cluster set up we can achieve these numbers if we use solely time partitioning, but I’d like to use space partitioning on a specific UUID to speed up query times. With space partitioning enabled we can achieve around 1.5x our incoming messages with 2 or 4 nodes, or 0.9x with 16 nodes. CPU and memory consumption are well within limits, and I don’t believe it to be an issue with the disks as IOPS and throughput are very low, and turning fsync off yielded no better results.
Would anyone be able to give me a hand with this? I’ll post more details in the thread
We ingest dynamic data from our users, so I can’t be too specific around database design and usage patterns, but these are some statistics I’ve been able to gather:
Num tables: 207 – Partitioned by ID: 161 – Partitioned by time only: 46
Distinct IDs – max: 7,859 – mean: 1,408.90
Rows per day: 5,997,405,714 – max: 593,721,087 – mean: 28,833,681.32
Database growth per day – before compression: 800.61GB – after compression: 121.99GB
Chunk sizes
- before compression – max: 4.41GB – mean: 0.17GB
- after compression – max: 0.49GB – mean: 0.03GB
Num chunks: 132,882
Message batches per day: 111,000,000
Average rows per batch: 54.03
We’re using at most 120 apps for inserting utilising 80 connections with PgBouncer transaction pooling, we found that more than that caused performance degradation.
We’re also using chunks of 1 hour, with a compression policy that kicks in after 48 hours, and a 30 day retention policy
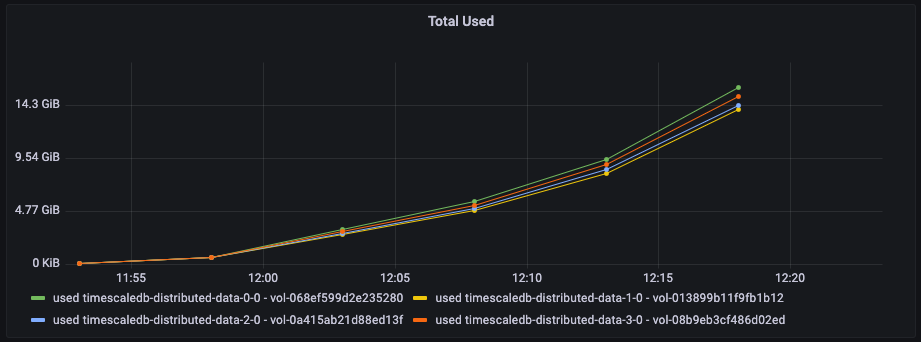
Hi @adam. Typically, space partitioning should give better performance for ingest since time-only partitioning often means that you are only writing to one data node at a time, which is the one hosting the current time chunk. Adding space partitioning should ensure you write to multiple nodes in the same time range, thus spreading the load much better.
Therefore, your results are surprising so I am wondering what is really going on. Can you somehow assess how well the ingest is spread across data nodes?
General things to think about for good ingest performance:
Try to use COPY instead of INSERT when possible
Insert in large batches (many rows in single transaction and statement)
Avoid using ON CONFLICT, triggers and RETURNING clauses if possible
As to those guidelines unfortunately we’re pulling our data from SNS and leverage the safety guarantees it provides to simplify app code. What this means for us is that we are limited to inserting up to 10 message batches at once, which skirts those safety guarantees but increases ingest performance slightly over inserting 1 batch at a time (but still not enough to keep up with single node ingest performance). However, because the data is completely dynamic we can’t rule out that each message in a batch isn’t for a different table, would COPY still provide a benefit in this case?
From running a couple of tests regarding the above, inserting a batch of 10 batches as a single batch gets us from ~1.5x to ~2x, while using COPY doesn’t work at all for our workload yielding about ~0.03x
Edit: The above is incorrect for COPY, it’s closer to ~0.5x
 thank you for your question. The forum is a great place for this as there’s quite a lot of detail. Let’s see if we can get you some help.