Do you ever need to see the spread of your data for some quick analysis? One of the best ways that you can do that is by creating a histogram. With TimescaleDB and PostgreSQL code you can even create a histogram right within your database terminal.
To create a histogram in the database, we will need to use the TimescaleDB histogram() function, and then PostgreSQL’s functions unnest(), generate_series(), repeat(), and CTE’s.
The histogram() function takes in the column you want to analyze and produces an array object which contains the frequency values across the number of buckets plus two (one additional bucket for values below the lowest bucket and above the highest bucket). You can then use PostgreSQL’s unnest() function to break up the array into a single column with rows equal to two plus the number of specified buckets.
Once you have a column with bucket frequencies, you can then create a histogram “image” using the PostgreSQL repeat() function. The first time I saw someone use the repeat() function in this way was in Haki Benita’s blog post, which I recommend reading if you are interested in learning more PostgreSQL analytical techniques. The repeat() function essentially creates a string that repeats chosen characters a specified number of times. To use the histogram frequency values, you just input the unnested histogram in for the repeating argument.
Additionally, I find it useful to know the approximate starting values for each bucket in the histogram. This gives me a better picture of what values are occurring when. To approximate the bin values, I use the PostgreSQL generate_series() function along with some algebra,
(generate_series(-1, [number of buckets]) * [max val - min val]::float/[number of buckets]::float) + [min val]
When I put all these techniques together, I am able to get a histogram with the following code structure:
with histogram as(
-- I input the column = value_col, the min value = 0, max value = 100, and number of buckets = 20
select histogram(value_col, 0, 100, 20)
from table_name tn
)
select
-- I use unnest to create the first column
unnest(histogram) as count,
-- I use my approximate bucket values function
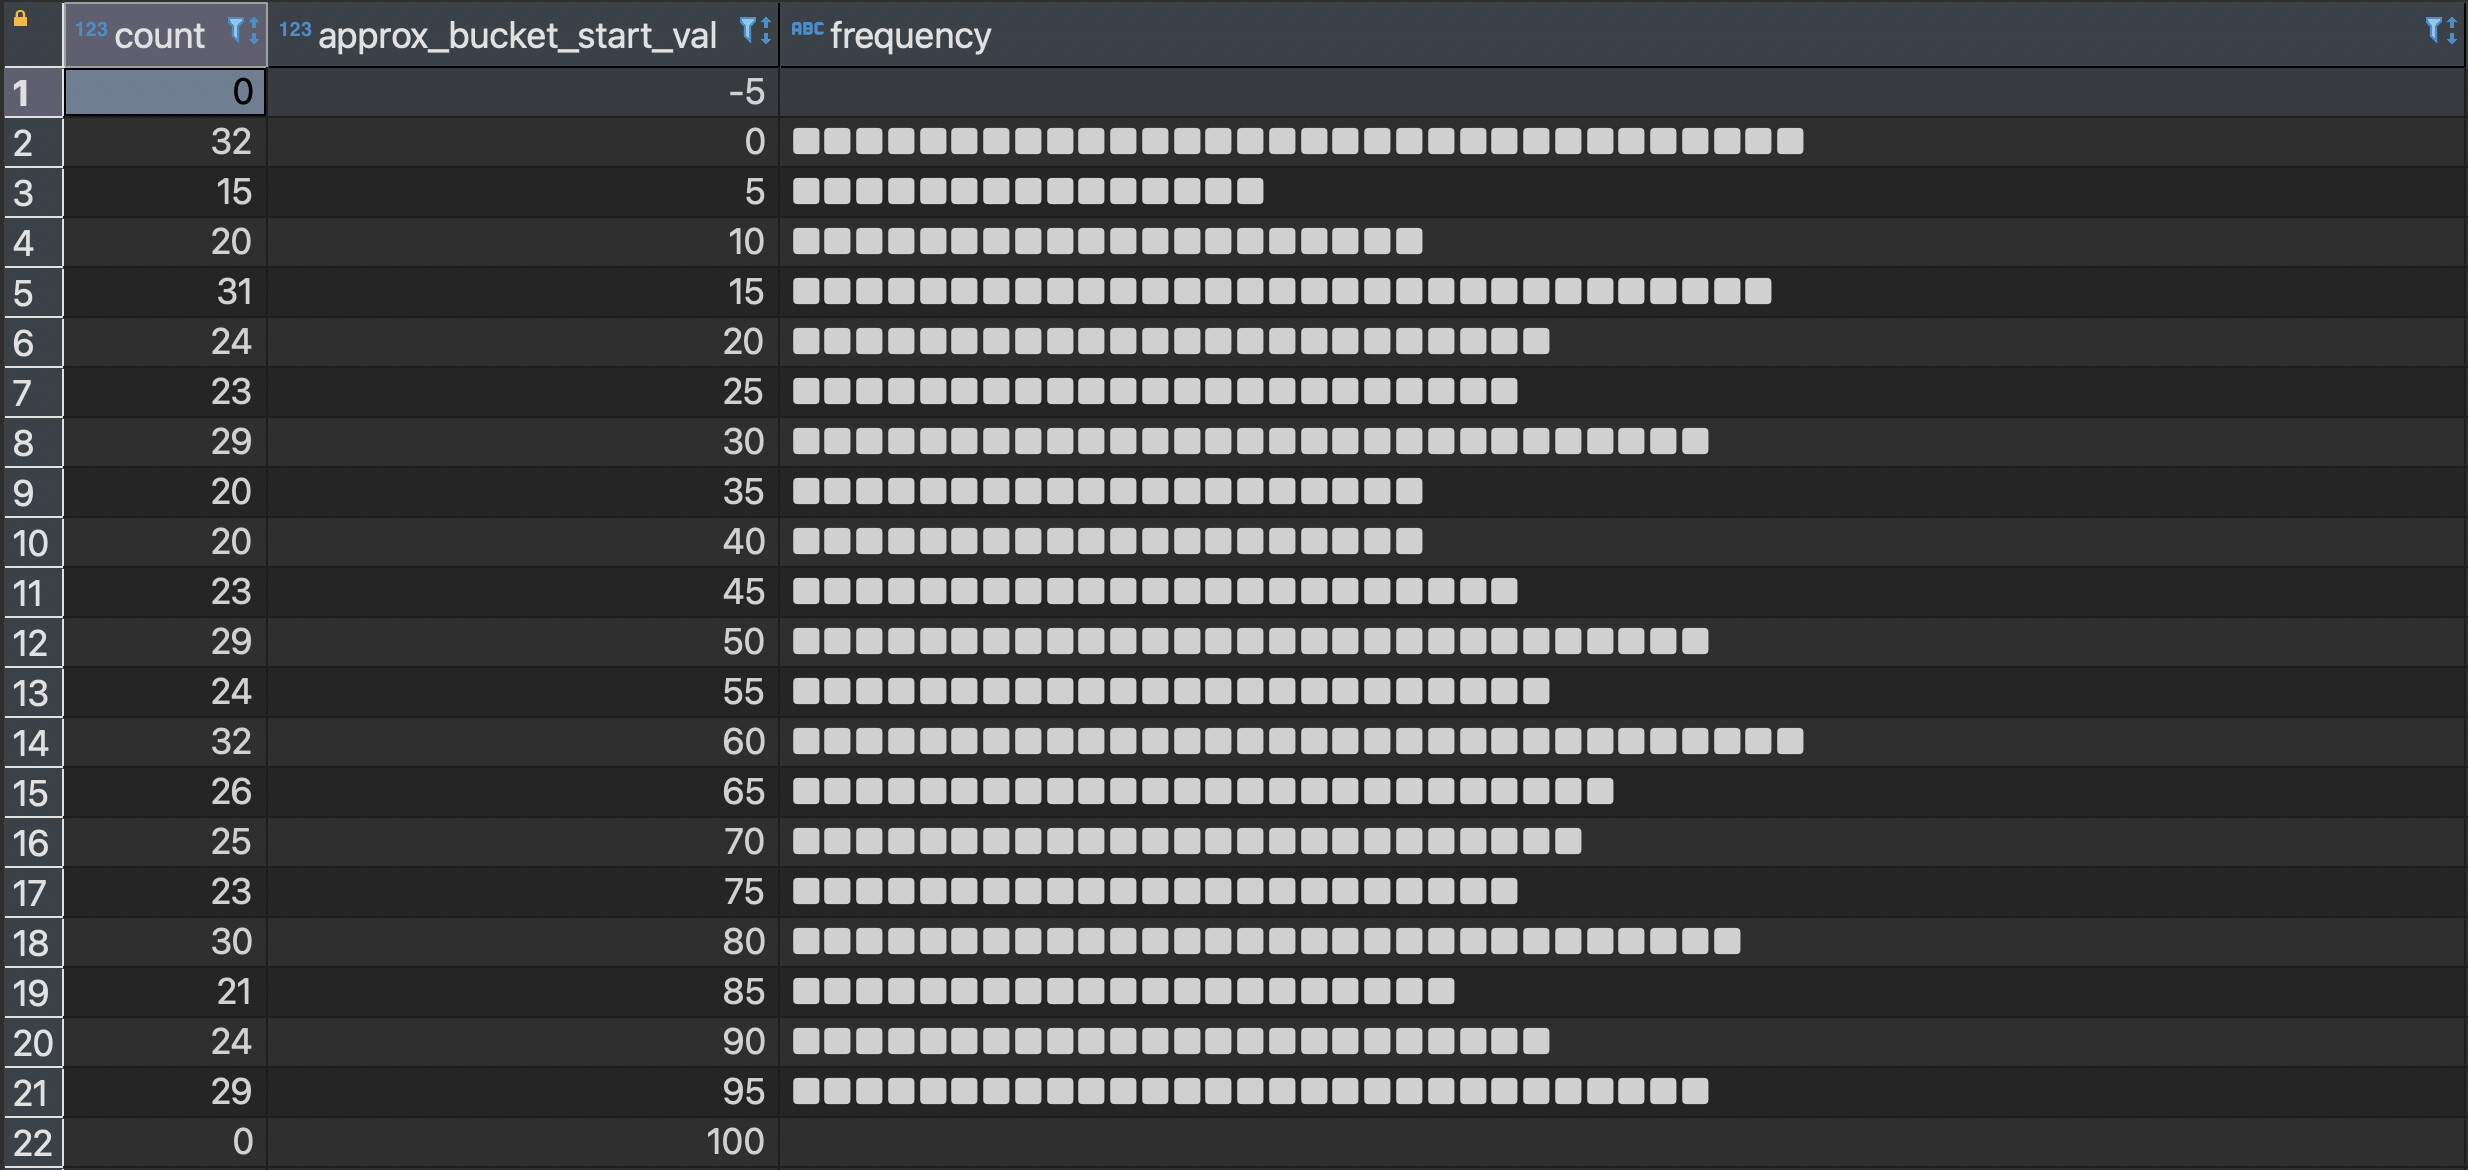
(generate_series(-1, 20) * 100::float/20::float) + 0 as approx_bucket_start_val,
-- I then use the repeat function to display the frequency
repeat('■', unnest(histogram)) as frequency
from histogram;