In brief:
My compression policy is somehow increasing the size of my data by over 100% instead of compressing. My data is stock tick data, I currently have ~ 1.7 Billion rows of data, and record about 40-60 million / day.
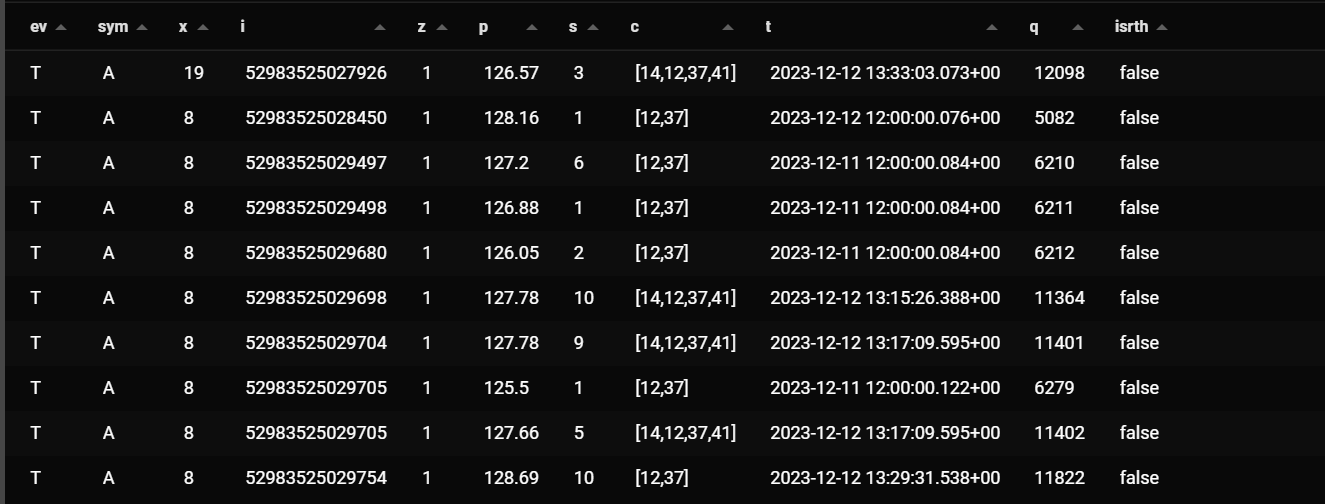
Schema: CREATE TABLE
public.trades (
ev text NULL,
sym text NOT NULL,
x integer NULL,
i text NOT NULL,
z integer NULL,
p numeric NULL,
s numeric NULL,
c integer[] NULL,
t timestamp with time zone NOT NULL,
q bigint NOT NULL,
isrth boolean NULL,
PRIMARY KEY (sym, i, t, q)
);
^
stock_system=# SELECT pg_size_pretty(before_compression_total_bytes) AS total
WHERE compression_status = ‘Compressed’;
total
77 GB
45 GB
47 GB
54 GB
69 GB
58 GB
(6 rows)
stock_system=# SELECT pg_size_pretty(after_compression_total_bytes) AS total
FROM chunk_compression_stats(‘trades’)
WHERE compression_status = ‘Compressed’;
total
170 GB
101 GB
106 GB
122 GB
155 GB
131 GB
(6 rows
TimescaleDB version: 2.16
PostgreSQL version: 16
Other software: Ubuntu 22.04
OS: Ubuntu 22.04
Platform: Self hosted
Install method: APT
Environment: Production
This seems to be my compression policy.
job_id | application_name | schedule_interval | max_runtime | max_retries | retry_period | proc_schema | proc_name | owner | scheduled | fixed_schedule | config | next_start | initial_start | hypertable_schema | hypertable_name | check_schema | check_name
--------±--------------------------±------------------±------------±------------±-------------±-----------------------±-------------------±---------±----------±---------------±-------------------------------------------------±------------------------------±--------------±------------------±----------------±-----------------------±-------------------------
1003 | Compression Policy [1003] | 12:00:00 | 00:00:00 | -1 | 01:00:00 | _timescaledb_functions | policy_compression | postgres | t | f | {“hypertable_id”: 1, “compress_after”: “5 days”} | 2024-01-28 02:37:31.905273+00 | | public | trades | _timescaledb_functions | policy_compression_check
I also found this in the schema. I’m not sure if the number of segmentbys is the problem.