Bug report (?) : inconsistent results when doing a sum

I may have found a bug here. Could someone please tell me what I should look for to understand this mystery :

I have 12 devices who give me each a value over time (every 10 seconds). These values are stored in a “teleinformation” hypertable (no custom chunk_time_interval, so I guess it’s still 7 days).

When I do this :

SELECT SUM(value), time
FROM teleinformation
WHERE code_device IN ('device_1_P', 'device_2_P', 'device_3_P', 'device_4_P', 'device_5_P', 'device_6_P', 'device_7_P', 'device_8_P', 'device_9_P', 'device_10.1_P', 'device_11.1_P', 'device_12.1_P')
GROUP BY time

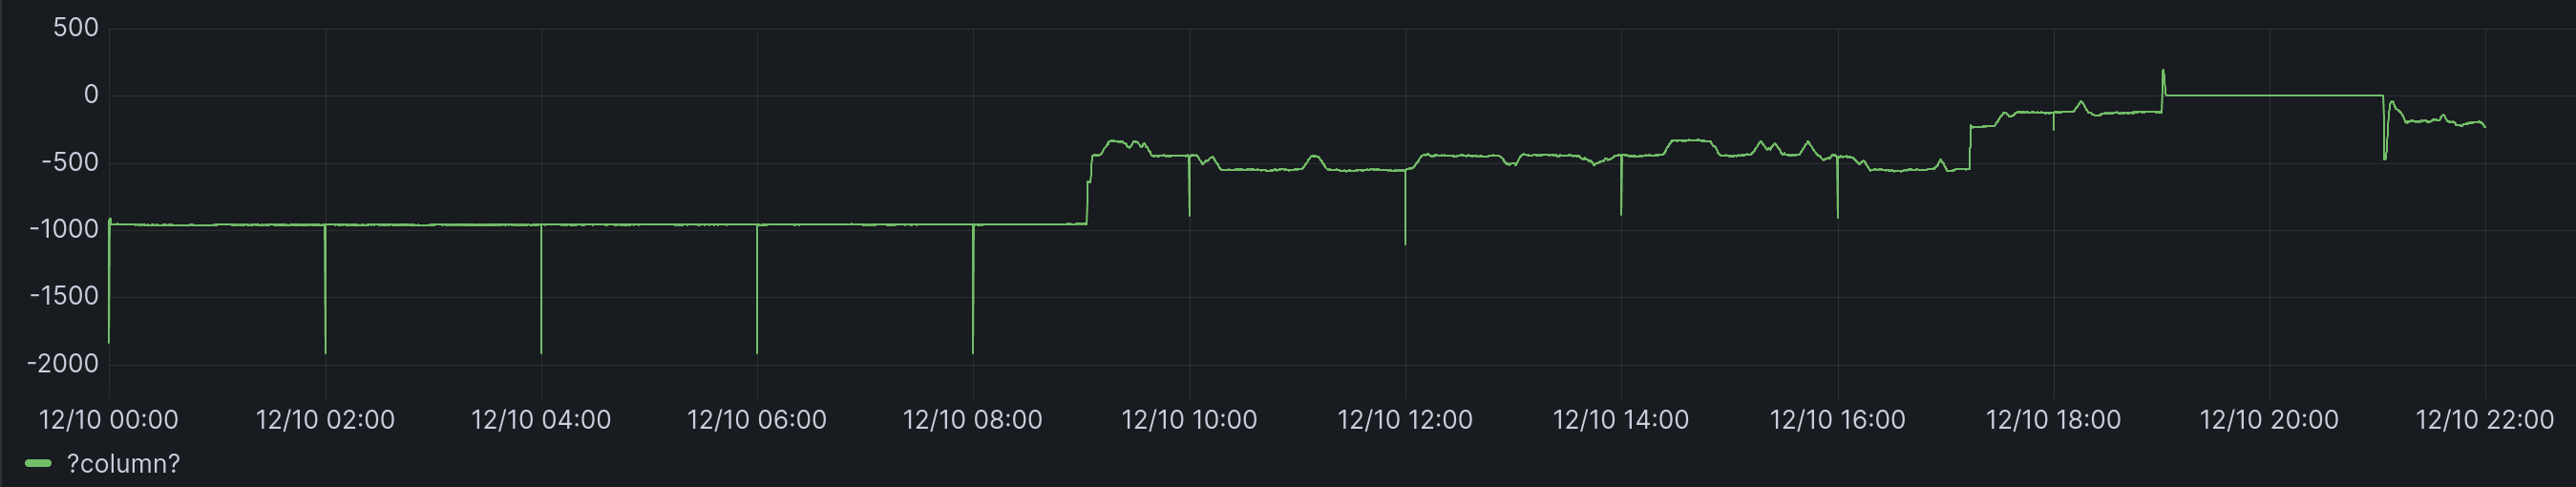
It takes ~200 ms in Grafana, but I get this chart with anormal spikes every 2 hours :

When I do this awful query :

WITH device_1 AS (
		SELECT value, time FROM teleinformation WHERE code_device = 'device_1_P'
	),
	device_2 AS (
		SELECT value, time FROM teleinformation WHERE code_device = 'device_2_P'		
	),
	device_3 AS (
		SELECT value, time FROM teleinformation WHERE code_device = 'device_3_P'		
	),
	device_4 AS (
		SELECT value, time FROM teleinformation WHERE code_device = 'device_4_P'		
	),
	device_5 AS (
		SELECT value, time FROM teleinformation WHERE code_device = 'device_5_P'		
	),
	device_6 AS (
		SELECT value, time FROM teleinformation WHERE code_device = 'device_6_P'		
	),
	device_7 AS (
		SELECT value, time FROM teleinformation WHERE code_device = 'device_7_P'		
	),
	device_8 AS (
		SELECT value, time FROM teleinformation WHERE code_device = 'device_8_P'		
	),
	device_9 AS (
		SELECT value, time FROM teleinformation WHERE code_device = 'device_9_P'		
	),
	device_10 AS (
		SELECT value, time FROM teleinformation WHERE code_device = 'device_10.1_P'		
	),
	device_11 AS (
		SELECT value, time FROM teleinformation WHERE code_device = 'device_11.1_P'		
	),
	device_12 AS (
		SELECT value, time FROM teleinformation WHERE code_device = 'device_12.1_P'		
	)
SELECT
	(device_1.value
	+ device_2.value
	+ device_3.value	
	+ device_4.value
	+ device_5.value
	+ device_6.value
	+ device_7.value
	+ device_8.value
	+ device_9.value
	+ device_10.value
	+ device_11.value
	+ device_12.value)
  , device_1.time
FROM device_1
JOIN device_2 ON device_1.time = device_2.time
JOIN device_3 ON device_1.time = device_3.time
JOIN device_4 ON device_1.time = device_4.time
JOIN device_5 ON device_1.time = device_5.time
JOIN device_6 ON device_1.time = device_6.time
JOIN device_7 ON device_1.time = device_7.time
JOIN device_8 ON device_1.time = device_8.time
JOIN device_9 ON device_1.time = device_9.time
JOIN device_10 ON device_1.time = device_10.time
JOIN device_11 ON device_1.time = device_11.time
JOIN device_12 ON device_1.time = device_12.time

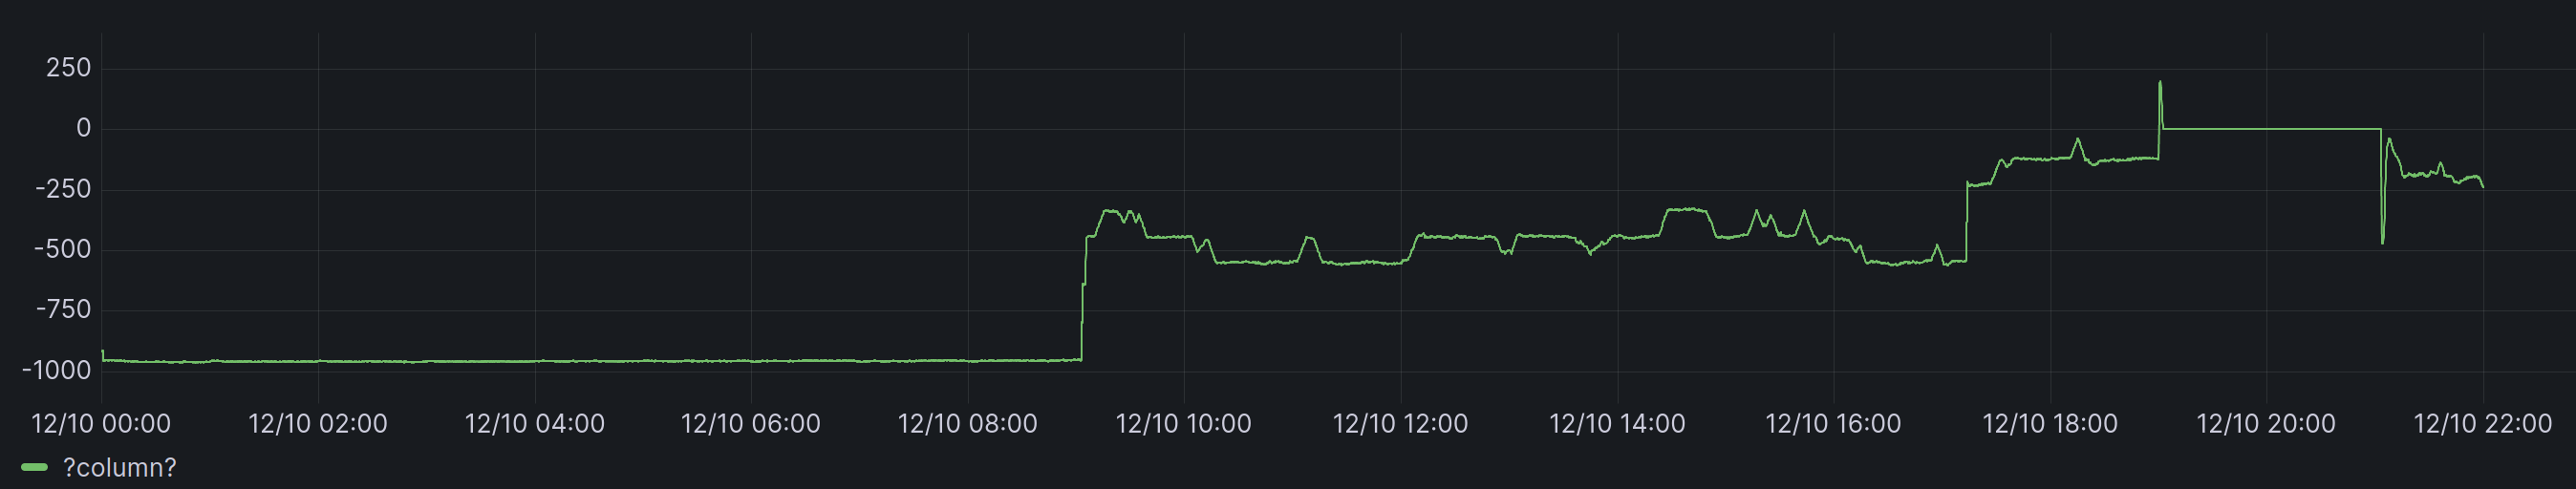
It takes much longer (~7 s), but gives me the good result without the anormal spikes :
<can’t insert 2 images in a post as new user : see the expected result in next reply>

Could someone please tell me what could be the cause of the anormal spikes every 2 hours, and how could I investigate it ? Could it be related to the size of chunks ? Is there a simple workaround ?

Here is the good expected chart I can’t put in the original post (the one I get with the second query) :

Those 2 queries are not equivalent while the sum() query will calculate from all available values for the time slot, the join query will only include times where all devices have reported a value due the join being an inner join. So it looks like whenever you see those spikes those are times where not all devices reported a value.

Ok, thanks I’ll look for that hypothesis.

I was more thinking about some duplicate insertions every 2 hours, but it wouldn’t give this result, would it ? The join would not de-duplicate, or can it ?

What is surprising is the exact same insertion in InfluxDb gives the chart without spikes, but I guess there are some implicit filtering…

Duplicate inserts would result in spikes upwards not downwards. You can get the same filtering like the join with the sum() query like so:

SELECT SUM(value), time
FROM teleinformation
WHERE code_device IN ('device_1_P', 'device_2_P', 'device_3_P', 'device_4_P', 'device_5_P', 'device_6_P', 'device_7_P', 'device_8_P', 'device_9_P', 'device_10.1_P', 'device_11.1_P', 'device_12.1_P')
GROUP BY time
HAVING count(time) = 12
ORDER BY time

Duplicate inserts would result in spikes upwards not downwards.

Well, u don’t know that, my values can be positive or negative, and I actually add “-” to the sum -SUM(value) to display the chart.

Oh you are right, i assumed your values would be positive. You can have grafana display the number of values per time slot like so:

SELECT count(value), time
FROM teleinformation
WHERE code_device IN ('device_1_P', 'device_2_P', 'device_3_P', 'device_4_P', 'device_5_P', 'device_6_P', 'device_7_P', 'device_8_P', 'device_9_P', 'device_10.1_P', 'device_11.1_P', 'device_12.1_P')
GROUP BY time
ORDER BY time

Ok, thank you for your help. After checking, I had double insertions every 2 hours, probably because I receive data in chunks of 2 hours. I have to put some unique index on (code_device, time) I guess.

There are still some surprising/counter-intuitive TimescaleDb or Grafana behaviors : for example, if I display my devices one by one, I don’t see any spike on any of them :

This query shows me I have 2 values instead of one at 4 a.m. :

SELECT code_device, value, time
FROM teleinformation
WHERE code_device = 'device_2_P'
AND time = '2023-12-10T04:00:00+01:00'

But when I display this in a chart :

SELECT value, time FROM teleinformation WHERE code_device = 'device_2_P'

I don’t see any spike or conflict or anything at 4 a.m., I guess Grafana just silently picks one of the available values for 4 a.m.

Also I still don’t understand why the join de-duplicates the data, but I guess i’m not used to do joins on non unique fields.

I’ve tried to add a UNIQUE index following your recommendations :

CREATE UNIQUE INDEX idx_teleinformation_device_time ON teleinformation(code_device, time DESC) WHERE code_device IS NOT NULL; -- Some teleinformations come from non device things with code_device = null

But when I try this PostgreSQL statement :

            INSERT INTO teleinformation (time, code_device, other_code, value)
            VALUES (:time, :codeDevice, :otherCode, :value)
            ON CONFLICT (code_device, time)
            DO UPDATE SET
            value = EXCLUDED.value

PosgreSQL tells me :

Caused by: java.sql.BatchUpdateException: Batch entry 0 (...)
 was aborted: ERROR: there is no unique or exclusion constraint matching the ON CONFLICT specification

I guess I have to do some more relational compatible model and split my teleinformations into uniquely indexable tables. This is a difference with InfluxDb where u can just add tags (but where it’s just impossible to combine metrics in InfluxQL).

I think it means you need to have an extra clause which the conflicts are not only on the two columns right?

I was creating my index with the “UNIQUE” syntax but it was not unique since some values was nullable in some cases, I guess it was the problem. Now I’ve splitted my data in multiple business tables according to their nature and all my index can be unique :slight_smile:

1 Like

Nice Tristan! thanks for sharing all insights and learning! I appreciate it :bowing_man:

Sometimes splitting the domains and simplifying make the computing branches much more efficient than just piling more constraints and make postgresql work harder :wink: