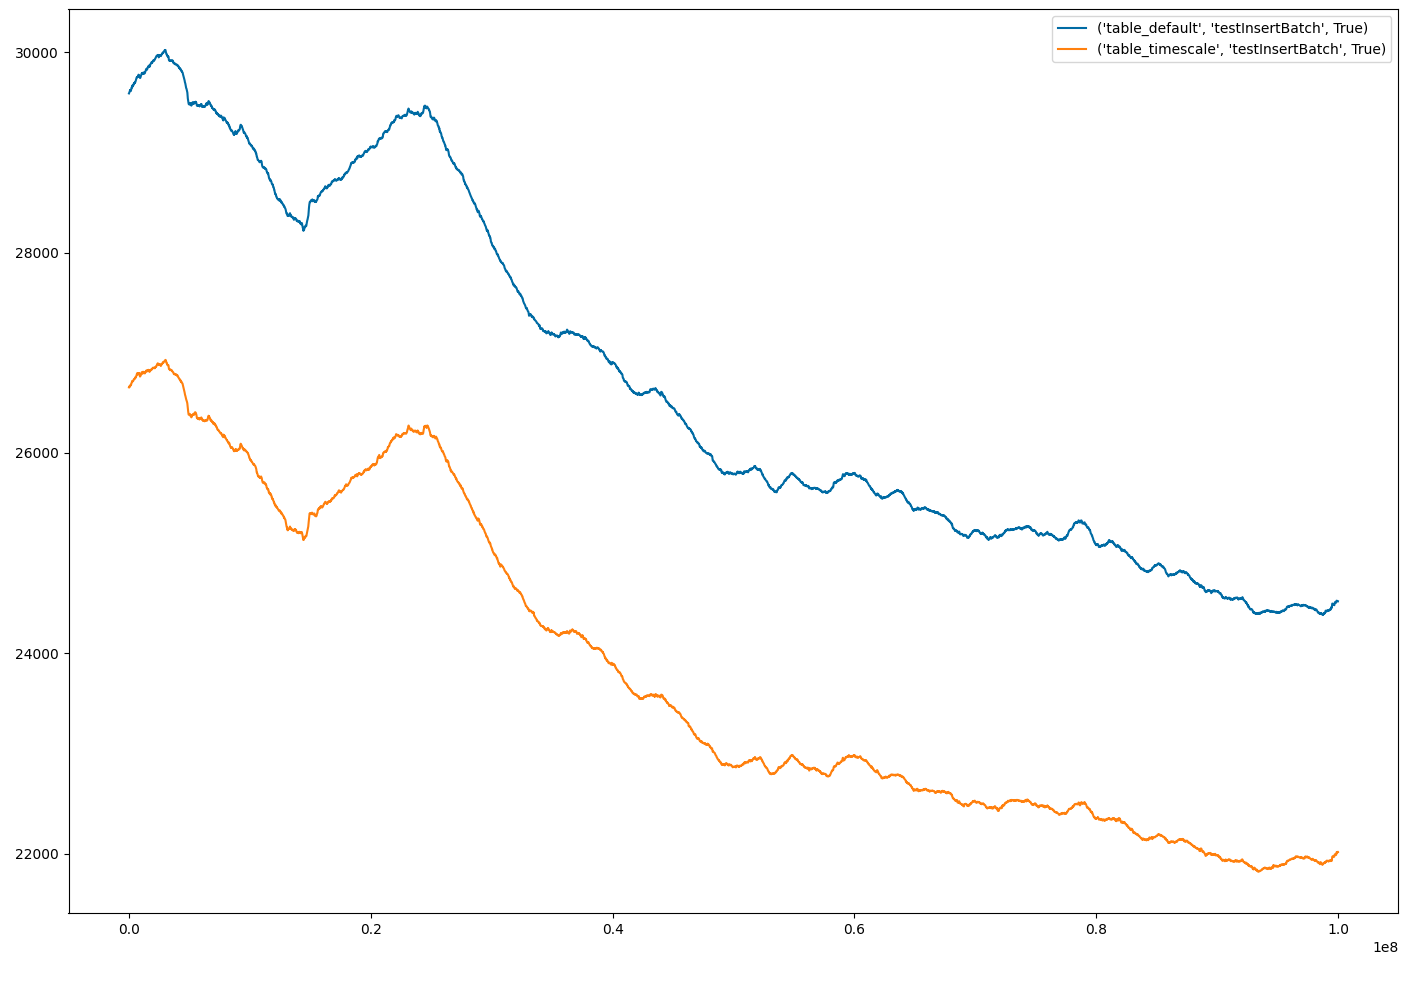
The data is inerserted in groups of 10000. The table table_timescale contains the hypertable. The inserted timestamps are contiguous and not random. This detail helps timescale a lot. But yet it does not reach the plain postgres speed.
Why do I have such different results in comparison to the documentation?
Thanks for reaching out. Without more detail about your set and data, it’s nearly impossible to say why you’re seeing these results.
I can say that I’ve just been spending the last few weeks testing the newest Timescale and Postgres (both partitioned and unpartitioned) with upwards of 3 billion rows and Timescale has never been slower than Postgres.
It’s also interesting to me that the shapes of your data are exactly parallel which doesn’t seem correct to me either. If TimescaleDB is setup correctly and partitioned correctly, I’d expect that trend to be more consistent based on hundreds of benchmarks I’ve run over the last two years.
Are you using a specific tool or something you’ve written yourself?
Thanks for your answer. I will try to give you the details.
For my performance test i am using python. I insert the data with the function psycopg2.extras.execute_values() and 10000 datapoints per call. The time needed to execute the function is written down. Each datapoint contains a timestamp, increasing 1 second per datapoint. When tim is at the end of 2021, it starts again at the beginnning of the year 2021. In the test I have inserted 100,000,000 datapoints into both tables.
My Virtual Machine has 16GB Memory and runs Windows 10.
And this is what the data looks like in the database:
A few possible ideas with given your additional detail.
First, the Windows filesystem might impact a partitioned workload in a way we are unaware of. We don’t have any current benchmark experience there. It’s plausible that there is some interplay with the storage and the number of chunks. Again, all of our benchmarks are with a Linux distro (often Ubuntu), so maybe there’s a performance issue with partitions and Windows??
Second, you’re probably experiencing degredation with TimescaleDB is that you’re using a single worker based on your program description. Every benchmark we publish for testing/pushing ingest speed as high as possible use multiple workers because the smaller chunks generally allow just the right portions of indexes to be in memory while inserts are happening. At one thread, you’re probably incurring some planning penalty, although a 10% impact still feels a bit steep to me (which might point back to the Windows component)
Finally, I wouldn’t lower the chunk_time_interval to 1 day. We recently published a blog post on some considerations when setting this, and TBH, having 1 day chunks for 100 million rows feels pretty small here unless there’s another compelling reason to set it differently. A week or a month probably makes more sense for your testing.
Not PostgreSQL worker. Your Python script, as described, makes one connection to ingest 10,000 rows at a time. If you’re going for speed, multiple connections, all trying to push data as fast as possible, is the only way to achieve that.
Wouldn’t it be expected that a single insert on TimescaleDB is slower than on vanilla PostgreSQL, because extra work has to be performed? If yes, then indeed, a series of inserts performed serially would see that result as well. The graphs look like that, too.
In order to see a performance improvement from inserting via TimescaleDB I would assume that we need to produce contention, which will slow down vanilla PostgreSQL, but TimescaleDB will profit from using its chunks model. Contention is what happens in the real world, when potentially millions of IoT devices send sensor data every second or so.
If you don’t have contention, because you have only a few clients, but they are heavy users, then you are probably better off with vanilla PostgreSQL in terms of insertion speed. It may be different for querying your data, because that could produce contention even with just a handful of queries.