We run a simple SELECT * FROM table LIMIT 1 on a Hypertable with around 12 million rows.
From my understanding, this query should take close to no time since it just can take the first record it can find. However, it takes around 40 seconds to complete.
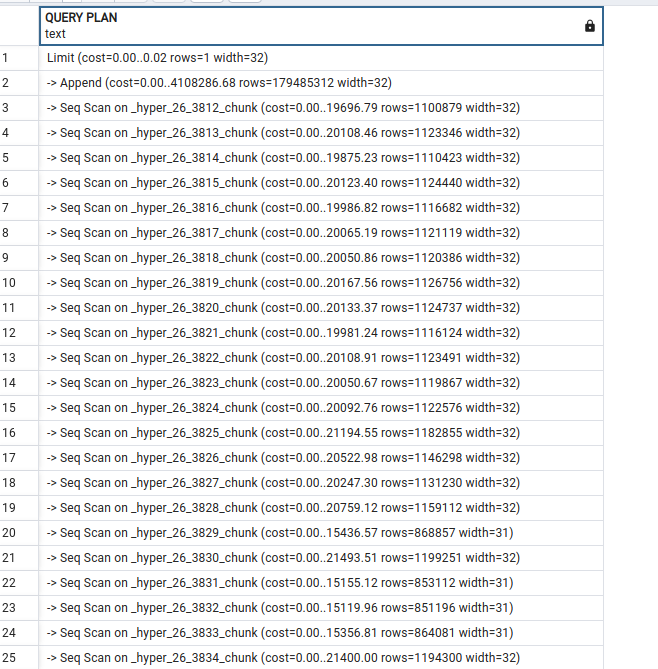
If I understand the query plan correctly, it looks like the database is iterating over each chunk.
If you run it with EXPLAIN ANALYZE rather than just EXPLAIN, what’s the ouput? Also, I haven’t used pgAdmin for a long time, is it possible to get the raw text of the EXPLAIN out instead of this row form?
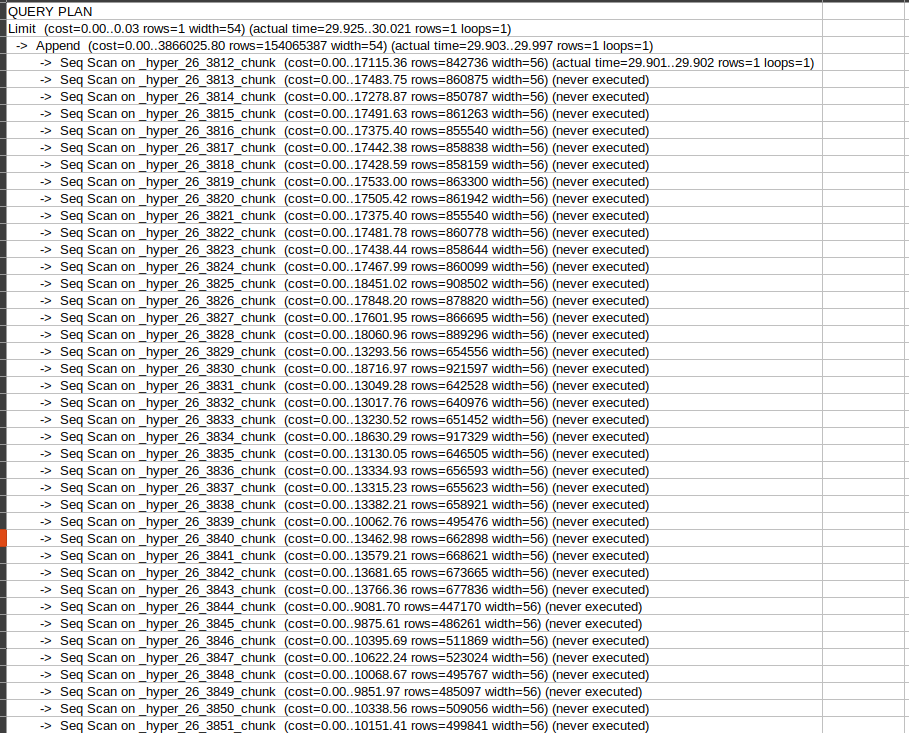
It seems it only executes the query on the first chunk as one would expect I guess.
I am not sure how to get the raw text. Are you looking for something specific?
As I said, I haven’t used pgAdmin for a very long time, but I think you can just highlight all the rows in that grid and copy them, which will give you the text version and is easier to read in this forum.
One thing to keep in mind is that a hypertable is partitioned on time (at least). This means that any query that doesn’t include a time predicate will cause the query planner to assume it has to look in every partition (chunk) even if it doesn’t. It will stop early once the data is retrieved (exactly what you saw with never executed), but it still has to plan that work.
However, looking at this output, a few things seem off to me, and I’m wondering if this is impacting your query in some way.
You mentioned in the first message that the query was taking ~40 seconds. In the second screenshot for the EXPLAIN, it shows 23ms. Any input there?
I also noticed that you said there were only 12 million rows in the hypertable, but TimescaleDB/Postgres seem to think there are 154+ million rows based on the plan estimate. Did I misunderstand how many rows there are or does this table just need to be ANALYZED to update statistics?
Regarding the first point:
I think I took the screenshot in a second run to get the query plan and the result was still cached. Hence, the short run time.
Regarding the second point:
The table seems to be growing rapidly. It now has 246,864,405 rows. I think I just remembered an old number. Sorry for that.
At the moment I have a problem reproducing the issue. But I think it could be because of the cache.
We also upgraded from Postgres 11 to 13 not sure if this could have fixed the problem.
Sorry for being not specific enough. I will try to reproduce the problem again.
Here is the output in raw format. It worked as you said.
Sometimes it’s hard to tell what change had the specific impact.
I will add again, however, that as your data grows and more chunks are added, that planning time will go up unless you add a WHERE filter on the time column in some way. And, this planning time is incurred on every run. Assuming this is real-time data and you’re looking to get the most recent row, even doing something like this will help:
...WHERE time > now()-'1 day'::interval...
As of TimescaleDB 2.7.2, using a dynamic time predicate like that will still pre-exclude the older chunks and significantly reduce execution time.
I’m having a similar issue with SELECT * FROM ht_06 ORDER BY irowversion DESC LIMIT 1, and I’d like to get values from the most recently irow column when the chuck is compressed
I can’t use the WHERE filter on the time column because the irowversion (bigint) column values come from a sequence and can be in any chunk.
I tried to set the irowversion column on the compress_orderby and compress_segmentby parameters, but the query did not performance well.
Using no compress chunk or partition table, the query performance is excellent, it is just few ms.
Is there a way to performance this type of query on compress chunks without using a WHERE filter on the time column?
I am using timescaledb version 2.8.0, and PostgreSQL 12.12 (Ubuntu 12.12-1.pgdg20.04+1)
The full table have more than 9 billion rows, 74 compressed chunk, and 7 no compressed
table_size | index_size | toast_size | total_size
------------±-----------±-----------±-----------
258 GB | 1176 GB | 153 GB | 1587 GB
Unfortunately, there isn’t in this specific use case. When the chunks aren’t compressed, you’re able to take advantage of the index on each chunk to some level. Without a time filter (the partition value), I would assume that your query plan still looks at each chunk to make sure it’s getting the biggest irowversion and then taking one final LIMIT. Because the chunks are not compressed, that’s a simple index lookup.
In compressed chunks, indexes can only be created on segment_by columns, but depending on the cardinality/density of irowversion in each chunk, that might mean you get poor compression. Even if you did, TimescaleDB will have to request a compressed row (in theory) from each chunk, uncompress all columns to form the rows (up to 1,000), and then filter to the one that you’re looking for. That’s a lot more work and I (again) assume you see something like this in the query plan.
IMO, your best best if you need this type of query often is to keep a tracking table that retains this data each time a new record for each irowversion comes in so that you can more easily query that table. Something akin to “Option 5” as outlined in this blog article from earlier this year.