Memory management settings to prevent OOM kills in Kubernetes

Hi, first I must say I’m enjoying the recent blog posts on pgsql caching and memory management:

I’ve also been encountering these problems in our production environment. We’re using the timescale high availability image with Patroni in our pods on azure kubernetes. (single node per db instance) We’re still on pg 13 with timescale 2.6.1, but will upgrade to latest 2.8.1 soon. Any given pod can run reasonably well for hours or days but then a Postgres process gets terminated by the pod’s OOM killer. This in turn causes the db to go into a recovery mode. Which can take from a few seconds to hours. Our app can tolerate the former but the latter is bad news…

It seems like many articles talk about the importance of correctly configuring memory on the pgsql server. So far we have only ensured that our memory limits are appropriate for our chunk size and ensured timescale tune runs on pod start using the given memory and cpu limit values. (I’d made an assumption that the image was otherwise optimally configured for timescale)

I’ve been trying to test the benefits of changing vm overcommit and transparent huge pages as described in the blog. But I’m unable to apply the changes on my aks pod, I can’t even do it on my local docker container. Errors like:
/sys/kernel/mm/transparent_hugepage/enabled: Read-only file system
And similar for setting vm.overcommit_memory

So far I’m just beginning to suspect that these vm.* namespaced settings are restricted in containerized environments.

So how does one apply these settings in kubernetes or docker? In this presentation by Oleksii Kliukin: https://www.postgresql.eu/events/pgconfde2022/sessions/session/3692/slides/309/pgconf_de_2022_kliukin_talk.pdf
He shares that the timescale cloud folks are using these settings in their solution on kubernetes, so I believe it’s possible - I just can’t work out how :slight_smile: I’m also a bit interested in the possible use of ‘OOM guard’ although I’ll revisit this once I’ve got the basics under control.

Anyway thanks in advance, I’m really looking forward to attending the pgconf in Berlin this week - I’ll be sure to come to the talks by the timescale team :slight_smile:

1 Like

Hello @ianf

Thanks for this. Indeed @Kirk_Roybal who wrote those blog posts is in Berlin so you should see if you can connect if you have the time. Ask someone on the stand to organize it for you!

That’s also my way of saying lots of folks are out this week, but I’ll make sure Kirk’s aware so he can maybe think about an answer :slight_smile:

Hello!

If you look back at Oleksii’s talk you will see that one of his points is that you can’t set these type of settings per container/cgroup in Kubernetes (side note - he’s actually at PGConf this week too!).

You can set them on the underlying OS, but in your case that is probably not an option either as you’re running Azure Kubernetes which won’t let you play with the underlying nodes. This would also mean those settings were global which you might not always want.

What are the memory request and limit settings you’re using?

Hi and thank you! Yes I got to speak to Kirk about this yesterday, and he had some interesting remarks - amongst other things why wouldn’t these changes be built into the image (also the transparent huge pages setting). I didn’t get to meet Oleksii so far, but had a good chat with Chris Engelbert who gave me a few other things to look at, inc JIT compilation.

James, yes I understand now that I’d need to set this at node level, and had actually talked to the devops engineer who manages the cluster about testing this when I first saw the slide deck a couple weeks back - and then there we had more firefighting due to OOM kills and it ended in the ‘forgot box’ :slight_smile: If it was possible in AKS then it wouldn’t be a problem for us to set it at node level, since we have one high memory node type that will be dedicated to timescale pods (our whole cluster is just for timescale at the moment anyway)

WRT the memory request and limits on our pods, it depends a little on the chunk size of the hypertable, and also how much grief the pod has given us. Generally our chunk size (1 day chunks) is about 600MB - 1GB, so we set the Limit to 4GB with the request only 1GB. When the pod runs timescale tune on pod startup, we get it to configure given that it has 4GB available. Also each pod’s database disk usage is typically around 500GB after timescale compression policies.

But, one of our heaviest (and most problematic) db instances has more like 4-5GB per chunk, 1.5TB-2TB of total disk. Here we’ve tried larger limits, going up to 16GB without it helping much. That’s not the only one though, I’d say that about 5 out of our 40 pods tend to regularly exhibit these kind of OOM behaviors, the other 4 are otherwise normal sized, but even for these ones throwing more memory at them doesn’t give us much relief, postgres always seems to consume all the memory it can get (and then a little more apparently).

In the past we also had probs with nodes terminating certain pods, because they were using too much mem. This seemed to be a more graceful termination for postgres, and didn’t seem to lead to unpredictable recovery times. Setting request = limit helped here, but it wouldn’t be sustainable for all our pods. I also read somewhere that ensuring a pod has Guaranteed QoS has some impact on reducing the oom killer’s oom_adj value for processes. TBH I don’t understand how / if that would help us.

Like I said, we’re on timescale 2.6.1 right now, I see in the release notes that many of the releases between here and 2.8.1 mention fixing memory leaks - wonder if one of those might be what’s hurting us. We are going to test an upgrade once I get back next week, also going from pgsql 13 to the latest 14. Of course our problem is only appearing in production, so it will be a little while before our upgrade gets there and we find out if it helps us.

We also see that our scheduled continuous aggregate policies sometimes fail because of insufficient threads. We have a maintenance app that I manually run to ‘gently’ refresh all continuous aggregates when this happens, first disabling policies, then running timescale commands to refresh for a time range covering a small number of chunks. I wonder if our failing continuous aggregate policy is building up a ‘debt’ of time periods it needs to refresh, and if this is related to my problem.

Now that I have gone on so long, I should maybe explain that each db has 5 hypertables, each with similar schema and the same policies, but in reality >99.99% of our data is in one hypertable. We have 2 continuous aggs per table (5 minute and 1 day)

Now that I’m away at pgconf and getting to reflect on things, I wonder if I’m trying to cure a symptom, but perhaps not recognizing the disease. Still it’s a really nasty symptom :slight_smile:

Thank you if you have managed to read all of this!

1 Like

Glad you got to meet Kirk and Chris!

I would really recommend upgrading, as you said there were some memory leaks and this could be hurting you.

I feel as though once you and your team have resolved all of these things you might have a great piece to share either here in the forum or as one of our developer Q&A pieces.

Be sure to message @CommunityTeam if that appeals to you when the time comes :tiger:

Late as always, but I should just write back to update on this issue.

It appears that approaches involving changing kernel settings are a non-starter for us, since we are using AKS and have very little control over the settings, even at node level. I’ve been through a few layers of microsoft support and for now have to accept that vm.overcommit_memory is stuck at 0, and transparent_hugepage is always.

To solve my problems, I took the approach of concentrating on the least stable server in the cluster, and arranging a weekend maintenance window.

So our main hope was to update our image version - deciding on the latest minor upgrade of postgresql 13.6 → 13.9, and timescaledb to latest.
In doing so we also decided to simply drop our existing continuous aggregates and recreate and repopulate them.

Unfortunately this didn’t have any noticable impact on performance or stability of our server.
Nor did throwing around some pg settings changes I had heard about, such as disabling jit compilation, altering max_parallel_workers_per_gather and setting hash_agg to off.

So I was having a pretty lousy weekend maintenance window, then I stumbled on an article that described a similar problem.

Although the article talked about connection lifetime in the django framework, our .NET app uses Npgsql which had a similar setting for connection pool lifetime.

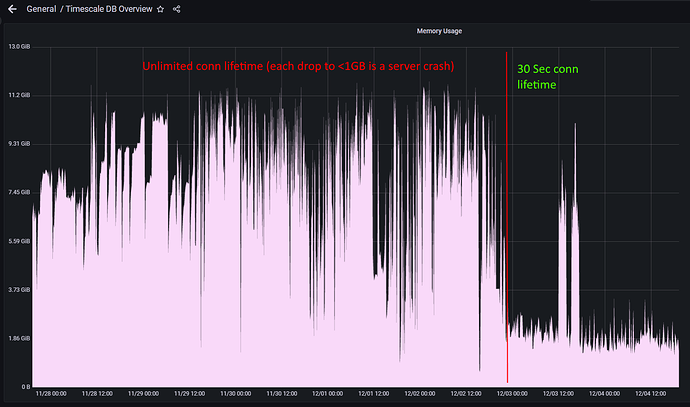
Changing the connection pool lifetime from its default of unlimited, to an arbitrary max 30 second lifetime showed an immediate and drastic improvement to memory usage and db stability.


The y-axis shows container_memory_working_set_bytes, and the pod in question actually has a memory limit of 8GB and timescale-tune had been run with an 8GB setting, so a clear red flag is that the pod was regularly exceeding this limit.

TBH I am still really surprised by the impact of this change. It seemed like the consensus was that connection pooling in pgSQL was a good thing, so it seemed obvious to stick with the default of leaving it enabled. We’d specified the pool size to be comfortably within the max connections on the server, and left the remaining settings as default. (Connection String Parameters | Npgsql Documentation)

In the case of this db, almost all the read queries were on a 5 minute continuous aggregate, just on different timeseries ids and different time ranges (the min timestamp varied from 1 week to 6 months ago, with the max timestamp value always 01.01.2099, just a quirk of the way the API clients were submitting requests - the db had only historic data). We also used prepared statements on our reads.

I suppose that either there is some caching done on the server side process, and that was not being flushed quickly enough in response to memory pressure, or perhaps there’s just a memory leak. Anyway, by enforcing a max lifetime on our pooled connections we ensured that the server side processes get terminated before they hang on to too much memory.

Since then I’ve rolled out the change to all instances, as well as improving our client implementation so that we don’t query these massive time ranges in a single query, and given some feedback to the users to perhaps make nicer API calls.

@LorraineP I would be really happy to share what I’ve learned, but I honestly don’t know what to say right now. What began with a structured approach, ended up with me just throwing manure at a wall until something stuck, and thankfully that has at least put out the biggest fire we were having with our app. In the new year I can look forward to starting on the next biggest fire :smiley:

Wishing you all a happy holiday!