Hello. I’m a newbie in TimescaleDB. I am inspired by this software and I’m going to learn all the documentation, but the number of unusual functions makes even my eyes run away 
I need to make statistics on periods (day|week|month|year) for example like this (but not the percentages , but the values):
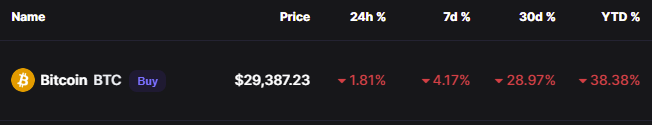
What is the optimal query I should make ?
I’ve been thinking about JOIN the table to myself 4 times and using bucket , but it looks scary 
1 Like
Welcome @padavan!
What kind of raw data are you working with for a query like this - raw tick data or something that’s pre-aggregated to something like 1-minute intervals?
Raw data is feed value change like
{ itemID: 1, value: 55, datetime: "2022-01-12T07:50:06.240+0000" }
I’d strongly suggest using Continuous Aggregates for this work. Particularly starting in TimescaleDB 2.7 they are extremely fast and allow you to retain historical rollups for much longer periods of time.
If you haven’t already, I’d suggest looking at our financial data tutorials, particularly the one on Crypto tick data and candlestick aggregates. Once you create your continuous aggregates similar to the one_hour_candle and one_day_candle examples in that tutorial, you could then query your data like this “on the fly” and it should be very responsive.
In this example, I’m using a CTE and the first query assumes you already have an index for symbol, time DESC created.
WITH current_tick AS (
   SELECT time, symbol, price FROM crypto_ticks
   WHERE symbol = 'BTC/USD'
   ORDER BY time DESC
   LIMIT 1
),
one_day_high AS (
 SELECT (ct.price - ohc.high)/ct.price::NUMERIC * 100 pdiff
  FROM one_hour_candle ohc, current_tick ct
  WHERE ohc.symbol = ct.symbol
    AND ohc.bucket < ct.time
  ORDER BY ohc.bucket DESC
  LIMIT 1
 ),
seven_day_high AS (
 SELECT (ct.price - odc.high)/ct.price::NUMERIC * 100 pdiff
  FROM one_day_candle odc, current_tick ct
  WHERE odc.symbol = ct.symbol
    AND odc.bucket < ct.time-'7 days'::interval
  ORDER BY odc.bucket DESC
  LIMIT 1
 )
 SELECT ct.symbol, ct.price, odh.pdiff "24_hour", sdh.pdiff "7_day",
 (ct.price-odc.high)/ct.price::NUMERIC * 100 "30_days"
  FROM one_day_high odh, seven_day_high sdh, one_day_candle odc, current_tick ct
  WHERE odc.symbol = ct.symbol
    AND odc.bucket < ct.time-'30 days'::interval
  ORDER BY odc.bucket DESC
  LIMIT 1;
Using current real-time crypto trade data, this query, using the CAGGs outlined in that tutorial, results in:
Name   |Value              |
-------+-------------------+
symbol |BTC/USD            |
price  |31573.3            |
24_hour|-0.669553071741001 |
7_day  |5.6360912543193145 |
30_days|-22.456632661140898|
HTH