
Postgres with time-series superpowers
TimescaleDB supports full SQL and adds features for time-series analytics. Use your favorite tools and existing skills.
More databases, more languages.
In the era of specialized databases, you don’t have the time to learn a whole new language or buy a bunch of new tools. You need to reuse your existing knowledge and skills. And you need to plug your database into your existing architecture and workflow.
You need TimescaleDB.
Use full SQL (and more)
Other databases make you learn a whole new language. Even worse, they force you to fit them into your architecture. TimescaleDB is different.

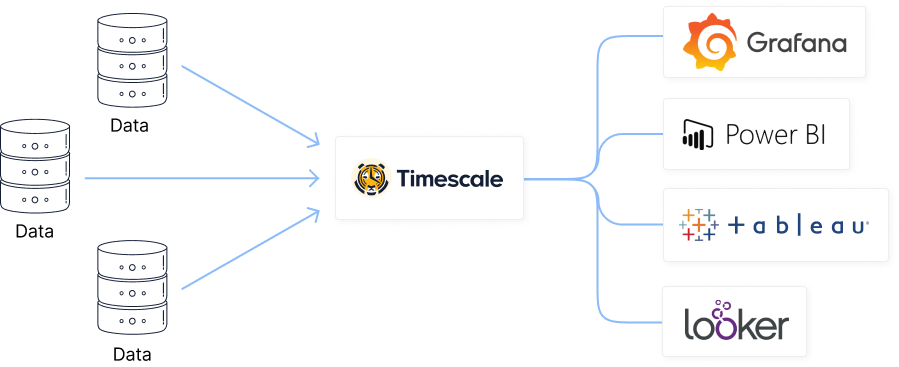
If it works with Postgres, it works with TimescaleDB.

Advanced features for time-series analytics, including time_bucket, continuous aggregates, and more.

Get all the flexibility of SQL. Use your existing skills. Use your favorite tools.

Build fast, powerful dashboards for the metrics you care about.

Join your relational data with time-series data and get a full view of your system.
Yes, SQL.
So you can use the tools you know and love.

Developers ❤️ TimescaleDB

“TimescaleDB makes it significantly easier to correlate data and visualize various environments. We were doing all these things before, but TimescaleDB makes it faster and better.”
Mahlon Smith, Senior Technologist, LAIKA
Read full story
“TimescaleDB facilitates our Grafana dashboards...a big advantage for our users is our ability to bring disparate datasets together into one database, with one graphical visualization tool.”
Rob Robinett and Gwyn Griffiths, the creators of WsprDaemon
Read full storyIf it works with PostgreSQL, it works with TimescaleDB.
Time-series data and visualizations go hand-in-hand. Get resources to build amazing visualizations using the tools you already know and love.

Getting Started with Grafana
Learn how to build 5+ interactive visualizations, including world maps and gauges, set up custom alerts for the metrics you care about most, and more.
See the docsGuide to Grafana 101 PlaylistMore resources on our blog
Visualize data with Tableau
Learn how to set up and run TimescaleDB queries from within Tableau and visualize your data, complete with installation instructions and tips.
See the docs