Unlocking Better Database Monitoring in PostgreSQL
As an ever-evolving open-source database, PostgreSQL has consistently expanded its monitoring and observability capabilities over the last few years to provide better insight into your database performance. These enhancements, especially notable in the latest PostgreSQL 16 version, underscore the community’s commitment to offering robust, user-friendly monitoring solutions that keep pace with the growing complexity of database management.
In this blog post, we’ll look at the latest database monitoring improvements in PostgreSQL 16 and introduce a better, more granular way to look into your query performance so you can quickly find new ways to speed up your database.
Enhanced I/O Monitoring in PostgreSQL 16
The introduction of pg_stat_io in PostgreSQL 16 is a step forward in database monitoring capabilities. This feature significantly differs from its predecessors by offering a more granular and comprehensive view of I/O operations.
The following result gives us the pg_stat_io view:
timescale=# \d pg_stat_io
View "pg_catalog.pg_stat_io"
Column | Type | Collation | Nullable | Default
----------------+--------------------------+-----------+----------+---------
backend_type | text | | |
object | text | | |
context | text | | |
reads | bigint | | |
read_time | double precision | | |
writes | bigint | | |
write_time | double precision | | |
writebacks | bigint | | |
writeback_time | double precision | | |
extends | bigint | | |
extend_time | double precision | | |
op_bytes | bigint | | |
hits | bigint | | |
evictions | bigint | | |
reuses | bigint | | |
fsyncs | bigint | | |
fsync_time | double precision | | |
stats_reset | timestamp with time zone | | |pg_stat_io breaks down the data into detailed statistics for each backend type and target I/O object. This specificity allows you to access rich data sets covering read/write operations, time allocations for these operations, and the intricacies of hits and evictions in shared buffers.
For example, pg_stat_io allows for evaluating the impact of VACUUM operations globally. You can understand how VACUUM processes affect the system by focusing on entries associated with the autovacuum worker backend type.
timescale=# SELECT * FROM pg_stat_io WHERE backend_type = 'autovacuum worker';
backend_type | object | context | reads | read_time | writes | write_time | writebacks | writeback_time | extends | extend_time | op_bytes | hits | evictions | reuses | fsyncs | fsync_time |
stats_reset
-------------------+----------+----------+-------+-----------+--------+------------+------------+----------------+---------+-------------+----------+-------+-----------+--------+--------+------------+-----
--------------------------
autovacuum worker | relation | bulkread | 0 | 0 | 0 | 0 | 0 | 0 | | | 8192 | 0 | 0 | 0 | | | 2023
-12-07 06:40:17.439866+00
autovacuum worker | relation | normal | 247 | 0 | 0 | 0 | 0 | 0 | 8 | 0 | 8192 | 19034 | 0 | | 0 | 0 | 2023
-12-07 06:40:17.439866+00
autovacuum worker | relation | vacuum | 146 | 0 | 0 | 0 | 0 | 0 | 0 | 0 | 8192 | 111 | 0 | 109 | | | 2023
-12-07 06:40:17.439866+00
(3 rows)The potential impact of `pg_stat_io` on large-scale database operations is significant. If you’re trying to fine-tune your PostgreSQL performance, this feature provides a deeper understanding of I/O patterns and bottlenecks for databases handling extensive data volumes and complex transactions. This level of detail is essential for tweaking database performance in high-demand environments, allowing for more precise resource allocation and optimization strategies.
But what if you want to look closer at your database queries? 🔎
A Better Way to Monitor Your PostgreSQL Database
Here at Timescale, we are heavy users of PostgreSQL’s monitoring tools. So much so, that we enabled pg_stat_statements, a PostgreSQL extension that records information about your running queries, in all Timescale services by default.
This PostgreSQL extension is crucial for identifying slow or problematic queries. It provides detailed data on query execution times and hit cache ratios, which is vital information for dissecting long-running queries and those that frequently require disk storage access, areas where PostgreSQL's native tools may fall short.
But, pg_stat_statements still wasn’t good enough for the level of insight we wanted to have into our queries. Plus, the extension won’t record information for queries running over longer periods and is limited to PostgreSQL-level details, meaning any helpful information from other extensions is left out.
Introducing Insights
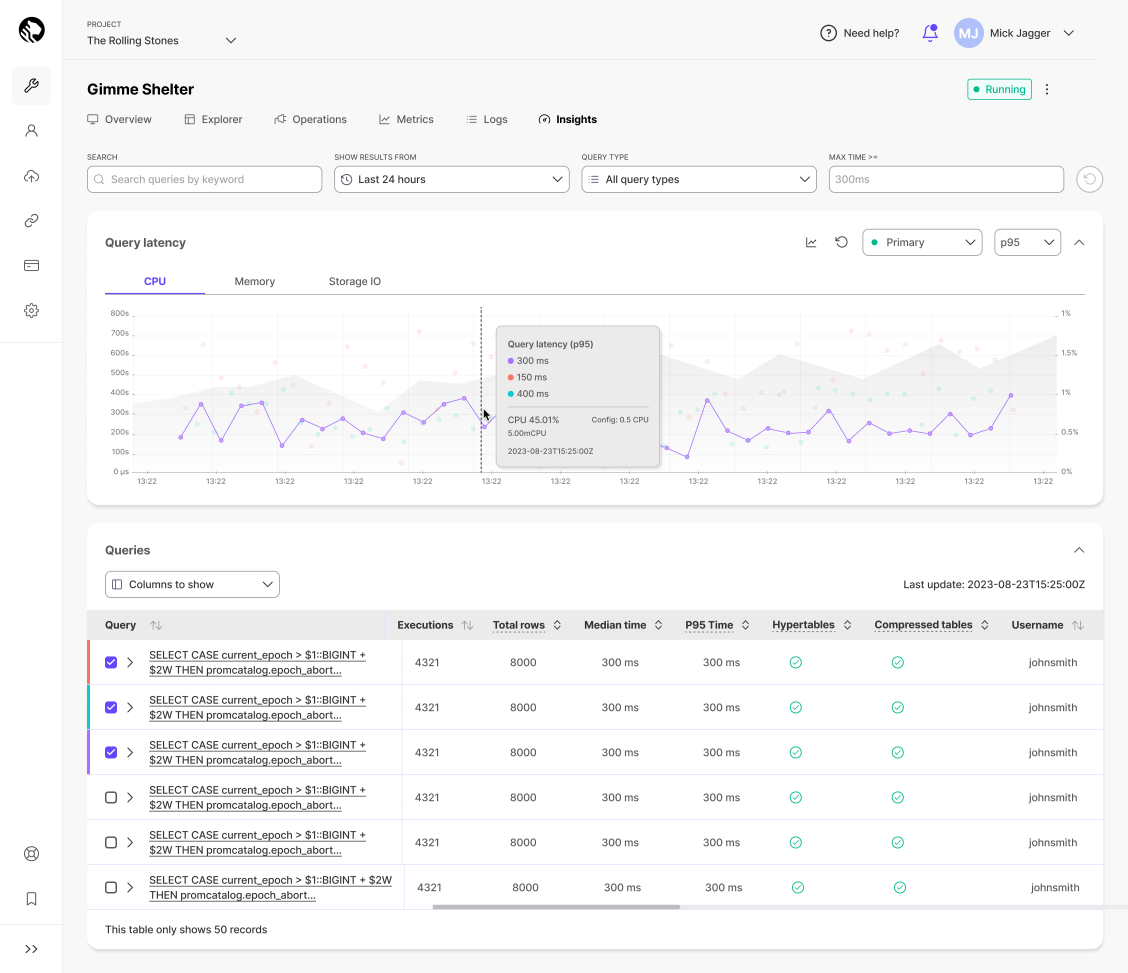
To complement PostgreSQL's native monitoring tools, we have introduced Insights, our innovative solution for in-depth database query analysis. Insights extends beyond the traditional monitoring capabilities of PostgreSQL by allowing you to observe database queries over extended periods.
With Insights, you can delve deeper into critical statistics on timing, latency, and memory usage than ever before, observing database queries over extended periods with a precision that PostgreSQL alone can't match.
The tool’s ability to track the evolution of query performance over time adds a dynamic dimension to database monitoring. You can leverage it to identify trends, predict future performance issues, and implement proactive measures. This is especially beneficial in environments with fluctuating workloads or where databases undergo frequent changes.
And, in this particular case, we’re putting our money where our mouth is: not only because we built Insights by dogfooding our own product—you can read the story of how we scaled PostgreSQL to 350 TB+ to achieve it—but also because it helped us find a bug in our own solution, a huge testament to its efficacy.

Analyze top queries using Insights

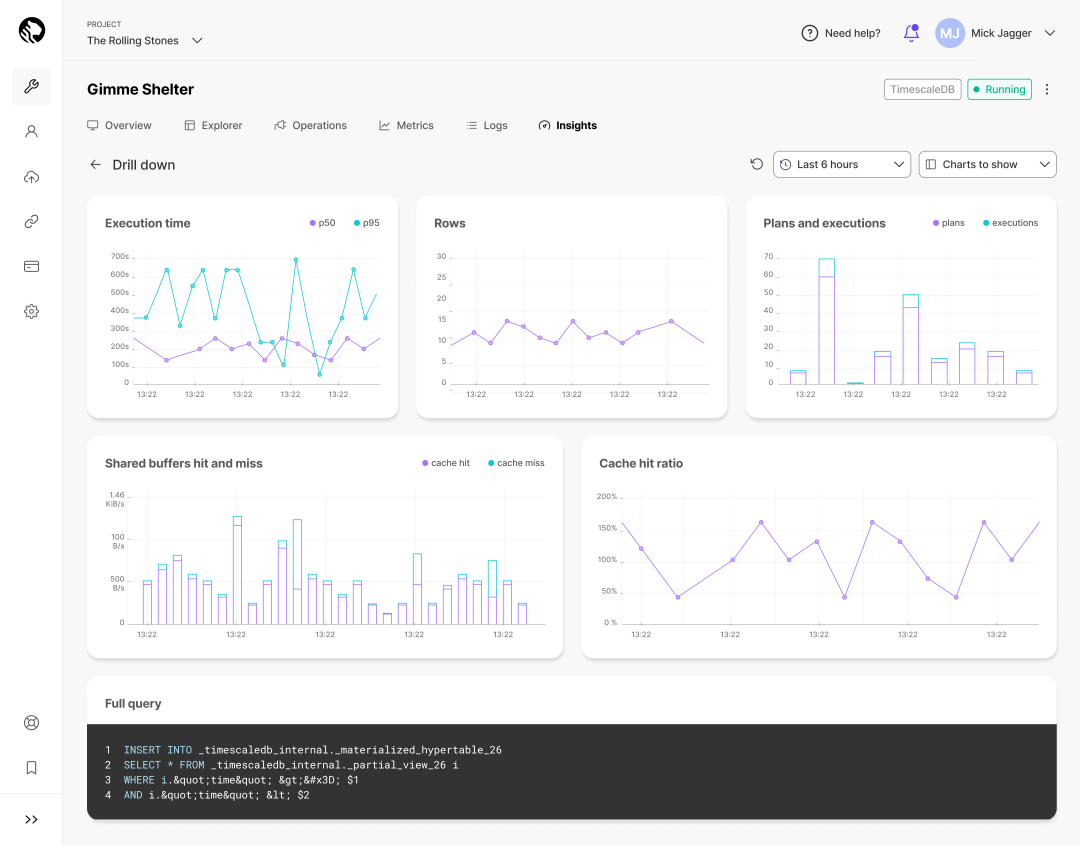
Drilling down on queries with Insights
By merging the two, we aim to make PostgreSQL database monitoring as convenient as possible. As mentioned, we've simplified the setup process for you by activating pg_stat_statements by default. This means you get instant access to comprehensive monitoring capabilities, streamlining the path to identifying and resolving performance bottlenecks. Then, in the Timescale console, you can use the Insights detailed views to achieve even greater granularity and improve your observability efforts.
Conclusion
The enhancements in PostgreSQL 16, particularly the pg_stat_io view, represent a significant advancement in database monitoring, offering you a deeper understanding of their database's inner workings.
Complementing these improvements, Timescale's Insights and the integration of pg_stat_statements provide unparalleled detail and granularity in database analysis. Now that you can quickly identify performance bottlenecks, check out our complete guides to improving PostgreSQL performance. From sizing your database to designing your schema, you’ll find best practices to speed up your database performance.
Written by Abhinav D. and Ana Tavares