Connecting a Raspberry Pi to PostgreSQL on the Cloud: A Step-by-Step Guide
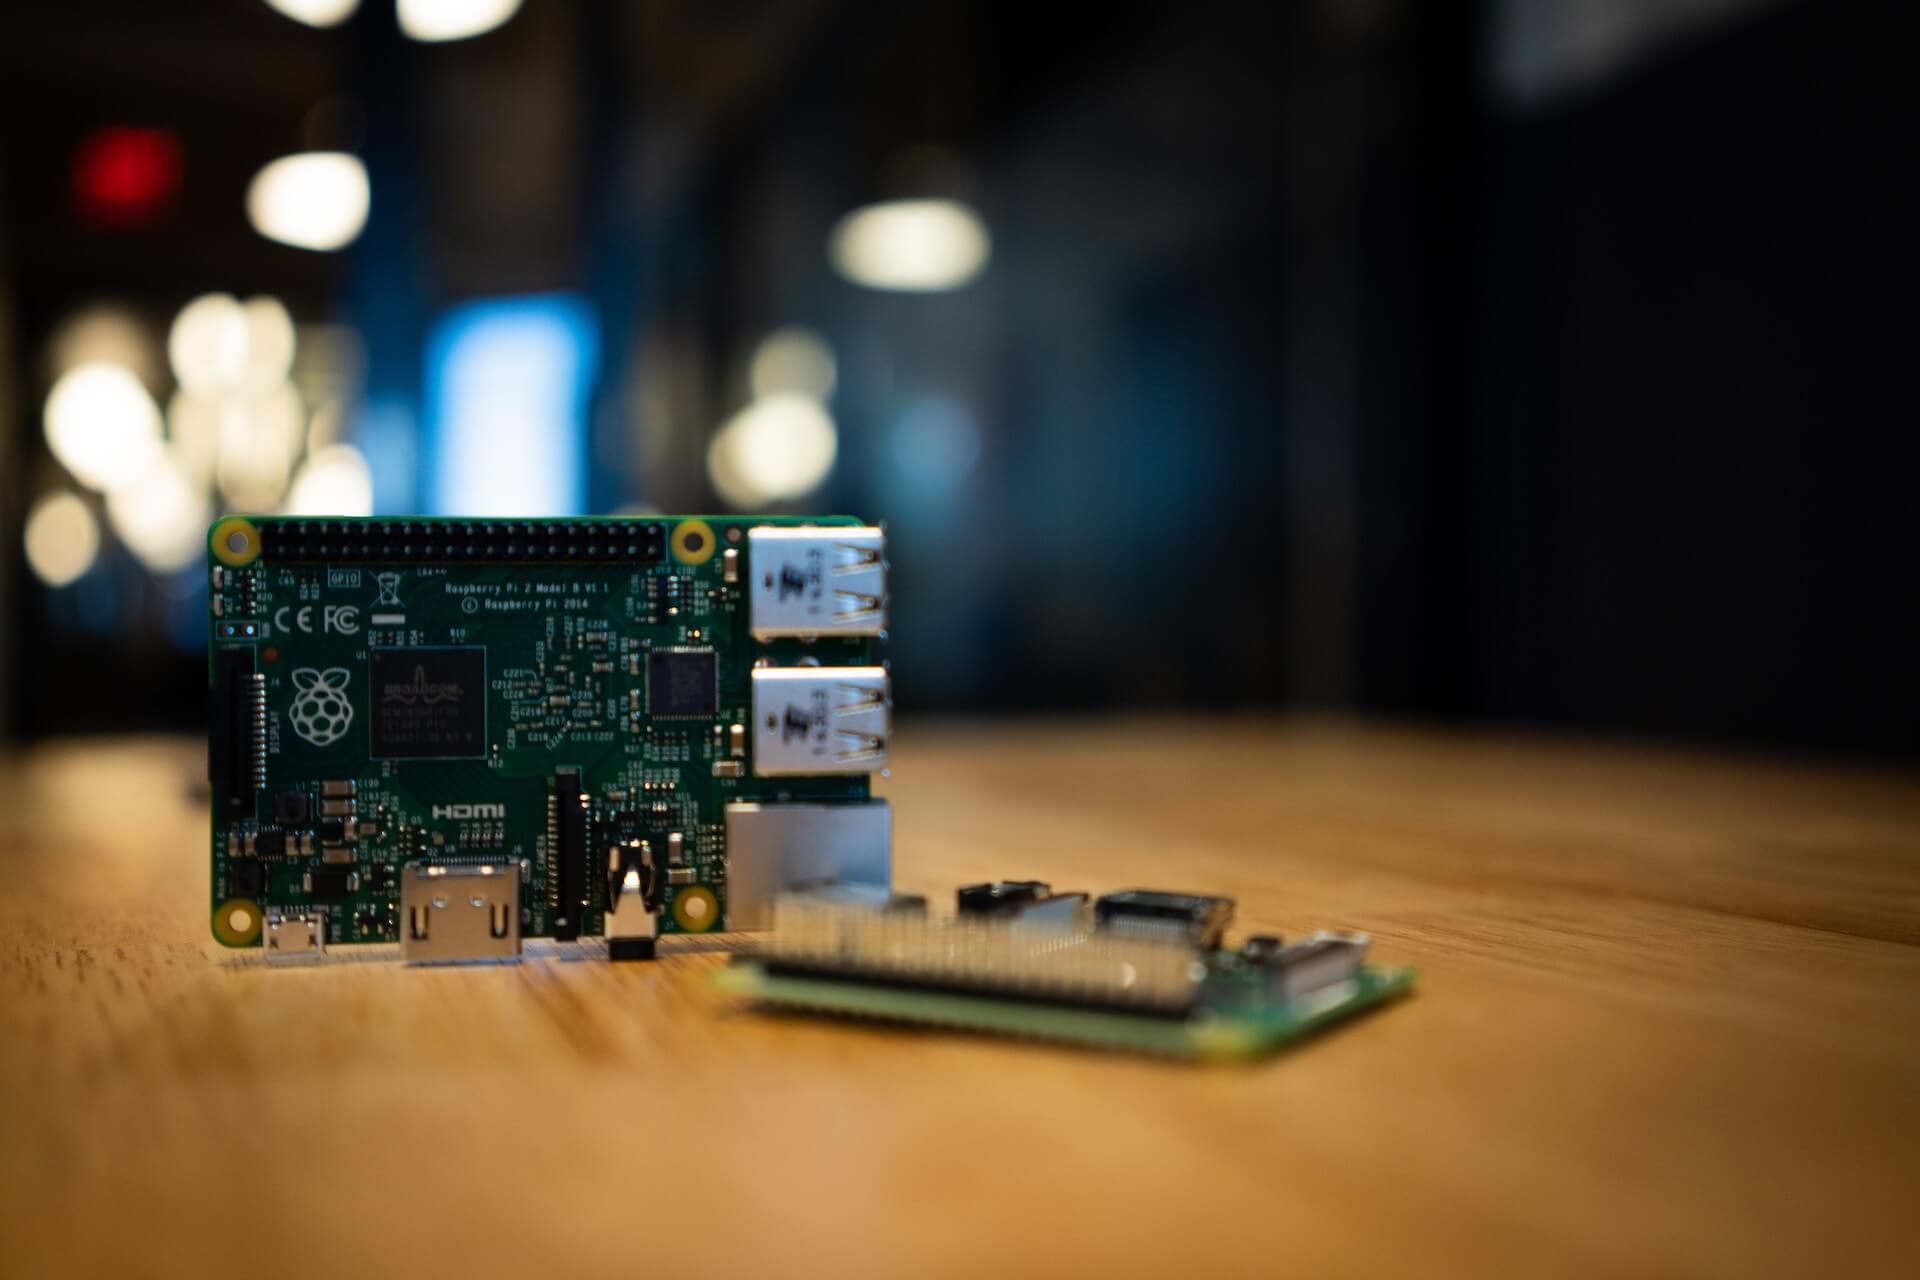
The Raspberry Pi is a relatively inexpensive (~$50) but powerful general-purpose computer. Although it was first developed for teaching basic computer science, it has now become incredibly popular for a variety of projects (even more here on HackerNews).
One of the main areas of usage for the Raspberry Pi has been IoT, in particular for edge deployments. In the context of IoT, developers can use a Raspberry Pi to serve as a prototype for larger-scale edge initiatives.
If you are collecting data from a Raspberry Pi-powered IoT prototype, you will need a reliable database to store that data. Enter PostgreSQL, the fastest-growing database today.
However, your IoT prototype is likely going to generate a lot of time-series data, and one of the challenges of PostgreSQL is that it does not scale well for time-series data. That is why we built TimescaleDB—a time-series database powered by PostgreSQL. In fact, TimescaleDB looks and operates just like PostgreSQL.
In this tutorial, we demonstrate how to create an IoT system based on a Raspberry Pi (the “edge”) and Timescale Cloud (for hosted TimescaleDB/PostgreSQL and hosted Grafana) to enable time-series data storage, processing, and visualization.
Before You Start
- Set up a Raspberry Pi device with a connected photocell light sensor.
- Create a new TimescaleDB instance.
- Create a Grafana instance via Timescale.
- Install the PostgreSQL database adapter for Python.
Overview

All the code and detailed instructions for the below can be found in this GitHub repository.
“The Edge” is a Raspberry Pi that has been wired to a photocell light sensor. Running on the device is a script (photoresister.py) which is recording the status of the light sensor at 5Hz.
Each observation is sent to a TimescaleDB instance (hosted on Timescale Cloud) and recorded in a hypertable. A Grafana instance (also hosted on Timescale Cloud) is connected to the database to visualize the light values.
Step 1: Setting Up Your TimescaleDB Instance
We need to create two things in Timescale: a TimescaleDB instance (to store the light sensor readings sent from the device) and a Grafana instance (to visualize the data in TimescaleDB).
Connect to your TimescaleDB
Connect to your TimescaleDB instance using psql and create the schema:
CREATE TABLE pi_obs(
  time timestamptz,
  metric text,
  value numeric);
Create a schema
SELECT create_hypertable('pi_obs', 'time', chunk_time_interval=>'1 week');
Connect to your Grafana instance
With the TimescaleDB instance running and the schema in place, it’s time to create a new Grafana instance.

Next, log into your Grafana instance and configure your TimescaleDB instance as a data source. With the data source in place, you can create a Grafana Dashboard that connects to that data source and will visualize the data in TimescaleDB.
Creating a dashboard
You can create the dashboard by importing the Grafana dashboard JSON found here.
Note: The above Grafana dashboard JSON assumes you have created a datasource “Timescale”, so please adjust as necessary.
Step 2: Setting Up Your Raspberry Pi
We are starting with a standard Raspberry Pi setup with Raspbian. For our light sensor, these resources will explain how to configure a photocell:

Create a Python script
With the photocell in place, we will set up the photoresistor.py Python script. This script runs on the device, which will write aggregate sensor readings and batch insert the data into the TimescaleDB instance in the cloud.
Create a system startup script
Create a systemd startup script that will help to ensure the sensor comes back online during reboot. Be sure to enable the TIMESCALEDB_CONNECTION within the environment variable.
Step 3: Using Grafana
With all the pieces in place (and letting the system run for a bit), here’s a snapshot of how the Grafana dashboard fluctuates over the course of ~25 minutes. You can see the light sensor readings show when we are in the light and in darkness.

Creating alert rules
Added bonus: Since Grafana supports creating alert rules, if you are feeling adventurous, you can set up a rule to send an alert when we are in the dark. Check out our docs for more information on configuring Grafana for alerting.

Next Steps
This is a small-scale demonstration of what it looks like to get an IoT sensor system running with a Raspberry Pi and Timescale. We hope this gives you some ideas about what you can create on your own.
If you are ready to get started, you can use this demonstration to get up and running today!